Fig. C.2
Download original image
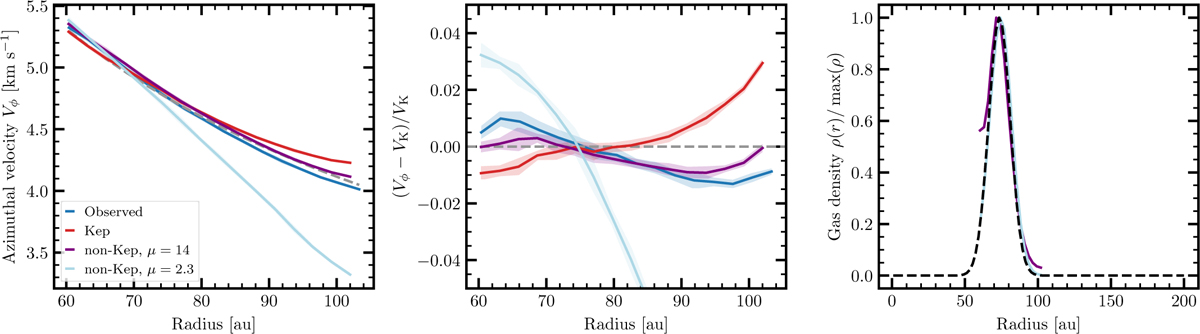
Left panel: Azimuthal velocity profile extracted from the simulated and real image cubes vs the best-fit Keplerian model of the real data (dashed grey line). Middle panel: Azimuthal velocity profile residual after subtracting a Keplerian profile. The shaded regions represent the 1σ uncertainty. Right panel: Gas density extracted from the two models with non-Keplerian velocities (solid coloured lines) compared to the input gas density (dashed black line). The dark blue line represents the profiles extracted from the real data. The light blue, purple, and red lines represent different models as indicated in the legend in the top panel.
Current usage metrics show cumulative count of Article Views (full-text article views including HTML views, PDF and ePub downloads, according to the available data) and Abstracts Views on Vision4Press platform.
Data correspond to usage on the plateform after 2015. The current usage metrics is available 48-96 hours after online publication and is updated daily on week days.
Initial download of the metrics may take a while.