Fig. 4
Download original image
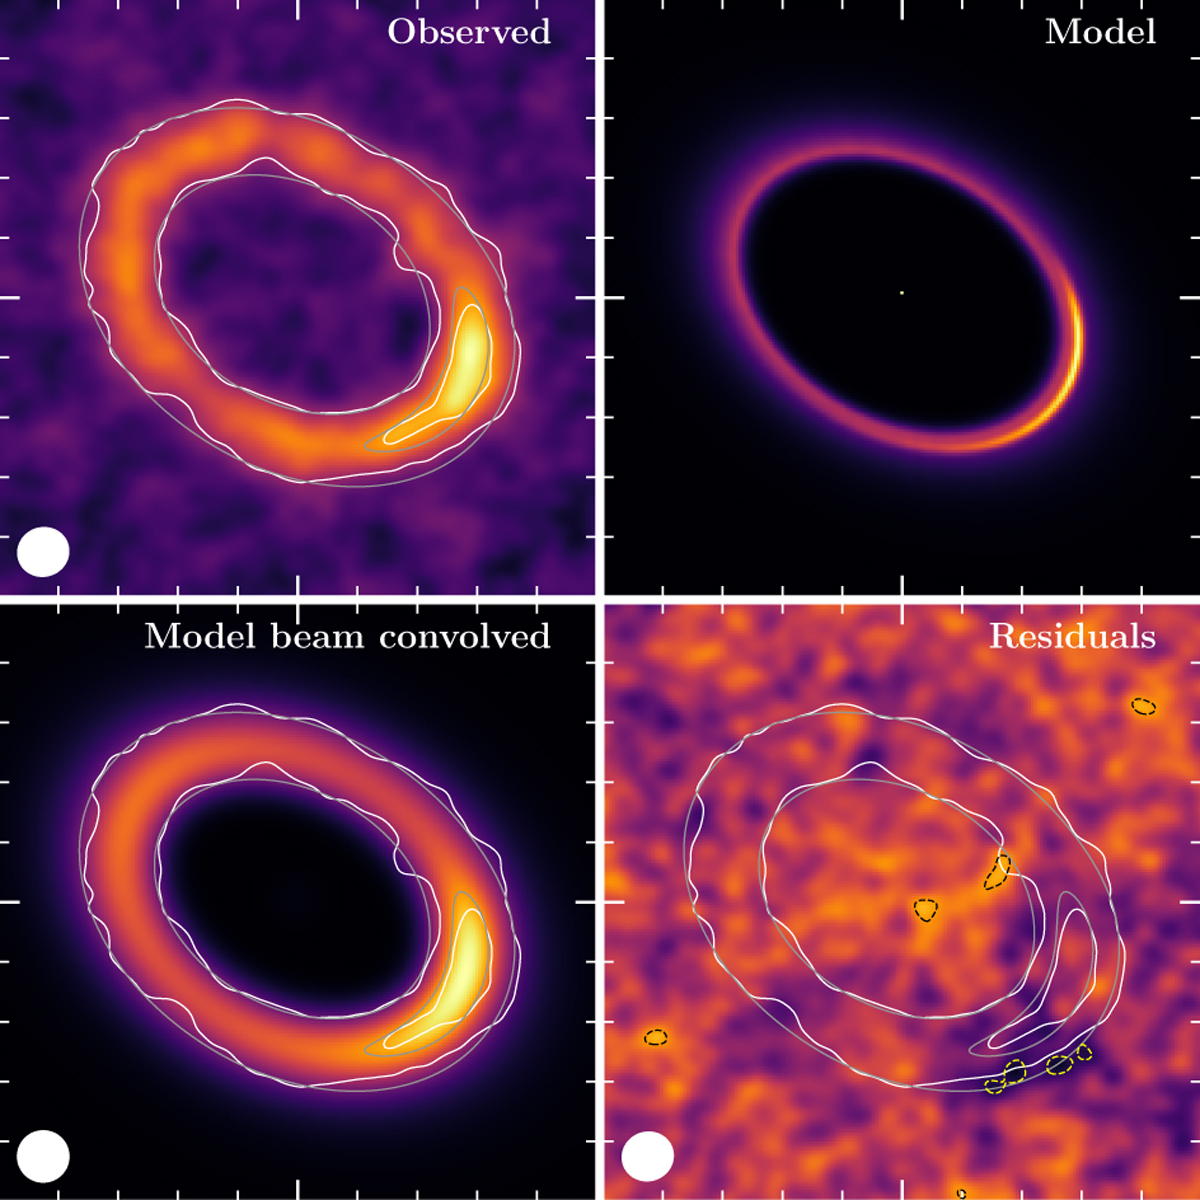
Comparison between observations and best-fit model. Top left: ALMA dust continuum image. Top right: synthetic image of the best-fit model. Bottom left: best-fit model image that has been beam-convolved. Bottom right: dirty image of the residuals after subtracting the best-fit model from the observed visibilities. The dashed black and yellow contours represent positive and negative 3σ values, respectively. The white (grey) contours represent an intensity that is 30 and 75% the intensity peak of the observed (convolved model) image. The beam sizes are displayed in the bottom left corners. All images correspond to a CLEAN robust parameter of 1.0. The small white ticks are spaced by 0.2″.
Current usage metrics show cumulative count of Article Views (full-text article views including HTML views, PDF and ePub downloads, according to the available data) and Abstracts Views on Vision4Press platform.
Data correspond to usage on the plateform after 2015. The current usage metrics is available 48-96 hours after online publication and is updated daily on week days.
Initial download of the metrics may take a while.