Fig. 6
Download original image
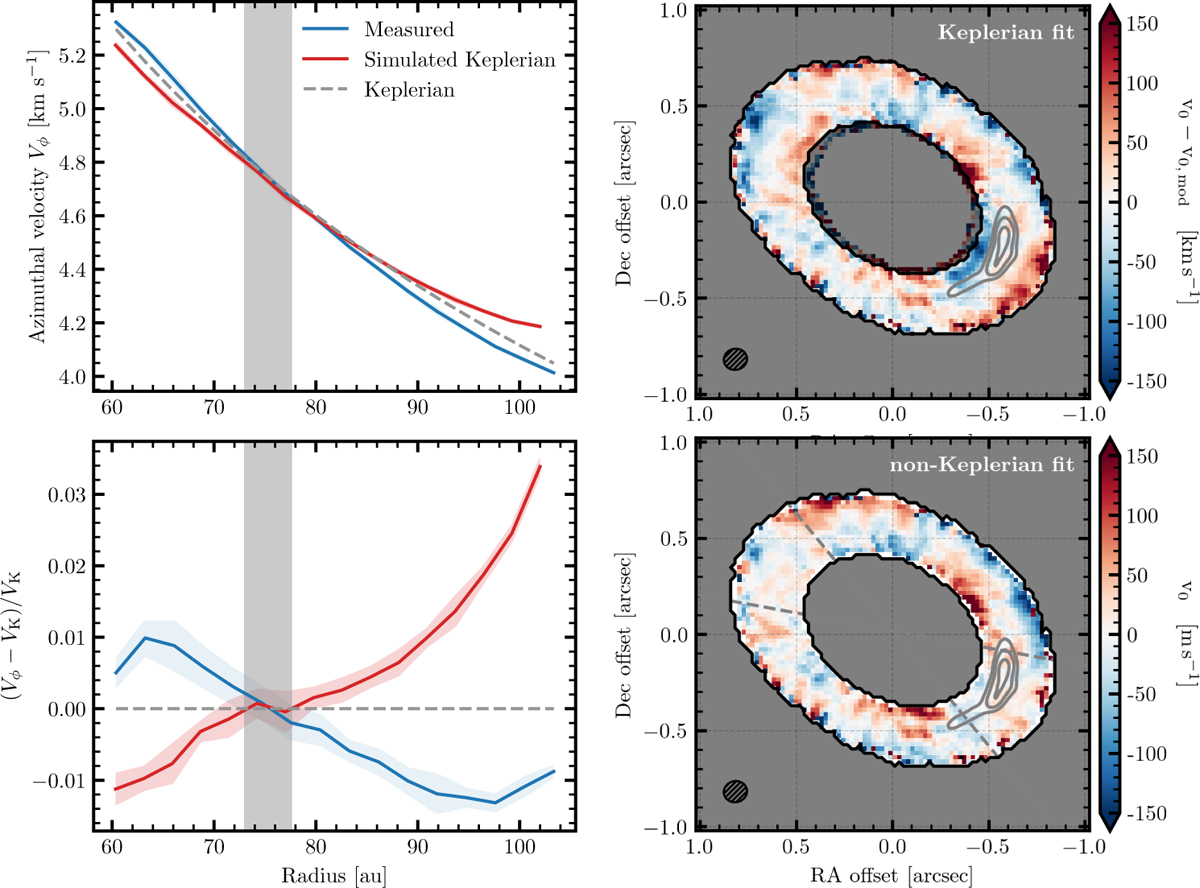
Azimuthal velocity profile fit. Top left: azimuthal velocity profile extracted from the observed image cube (blue line), from a simulated image cube of a Keplerian model (red line), and the expected Keplerian profile (vϕ ∝ r−1/2, dashed grey line). Bottom left: azimuthal velocity profile residual after subtracting the expected Keplerian profile. The blue- and red-shaded regions represent the 1σ uncertainty. The shaded grey region in the left panels represents the dust arc peak and extent. Top right: velocity map residuals after subtracting the best-fit Keplerian model. Bottom left: velocity map residuals after subtracting a model using the measured non-Keplerian azimuthal velocity profile. The dashed grey lines represent wedges used to fit the data near the disc’s major axis.
Current usage metrics show cumulative count of Article Views (full-text article views including HTML views, PDF and ePub downloads, according to the available data) and Abstracts Views on Vision4Press platform.
Data correspond to usage on the plateform after 2015. The current usage metrics is available 48-96 hours after online publication and is updated daily on week days.
Initial download of the metrics may take a while.