Fig. 7
Download original image
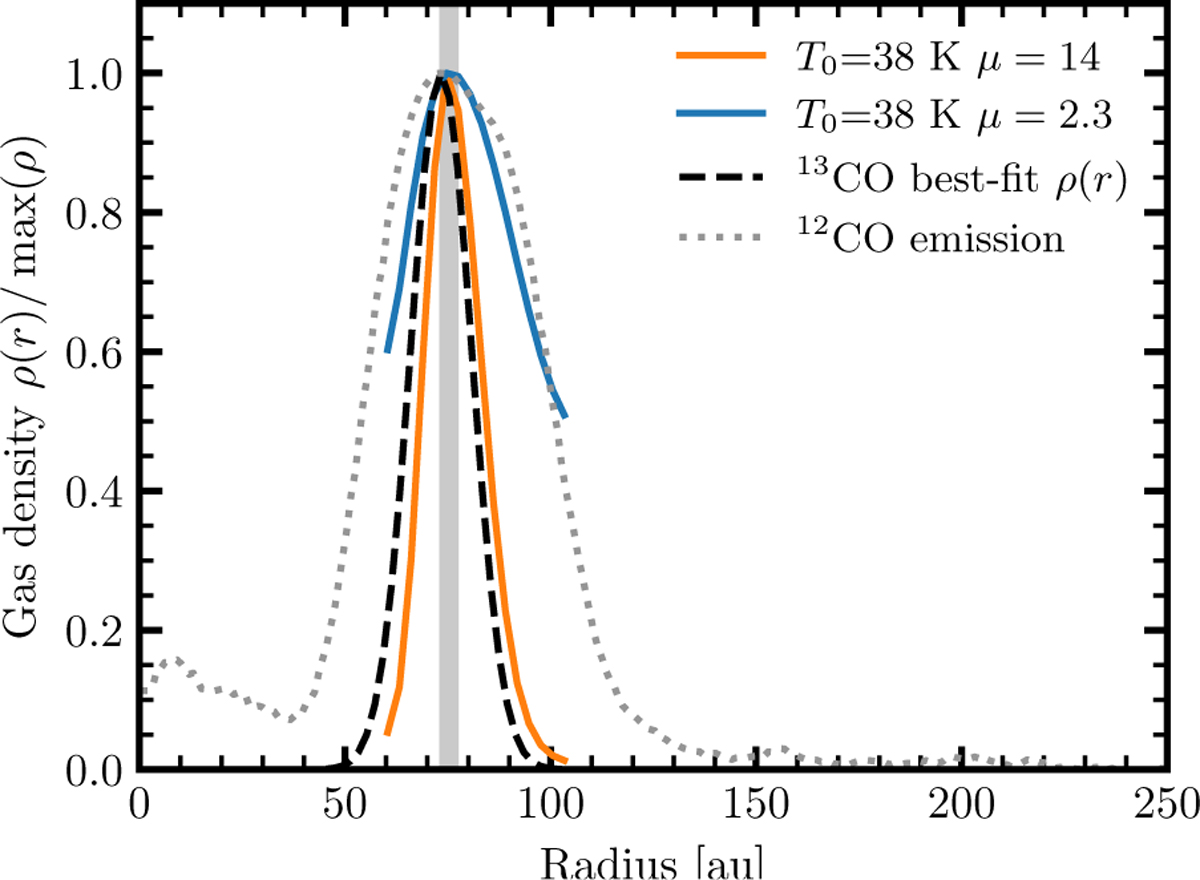
Retrieved gas density profile (solid coloured lines) using different gas temperatures and mean molecular weights. The dashed black line displays the midplane density profile of 13CO as derived in Brennan et al. (2026). The dotted grey line displays the 12CO gas emission profile (normalised). The vertical shaded grey region shows the location of the arc and dust surface density peak.
Current usage metrics show cumulative count of Article Views (full-text article views including HTML views, PDF and ePub downloads, according to the available data) and Abstracts Views on Vision4Press platform.
Data correspond to usage on the plateform after 2015. The current usage metrics is available 48-96 hours after online publication and is updated daily on week days.
Initial download of the metrics may take a while.