Fig. B.1
Download original image
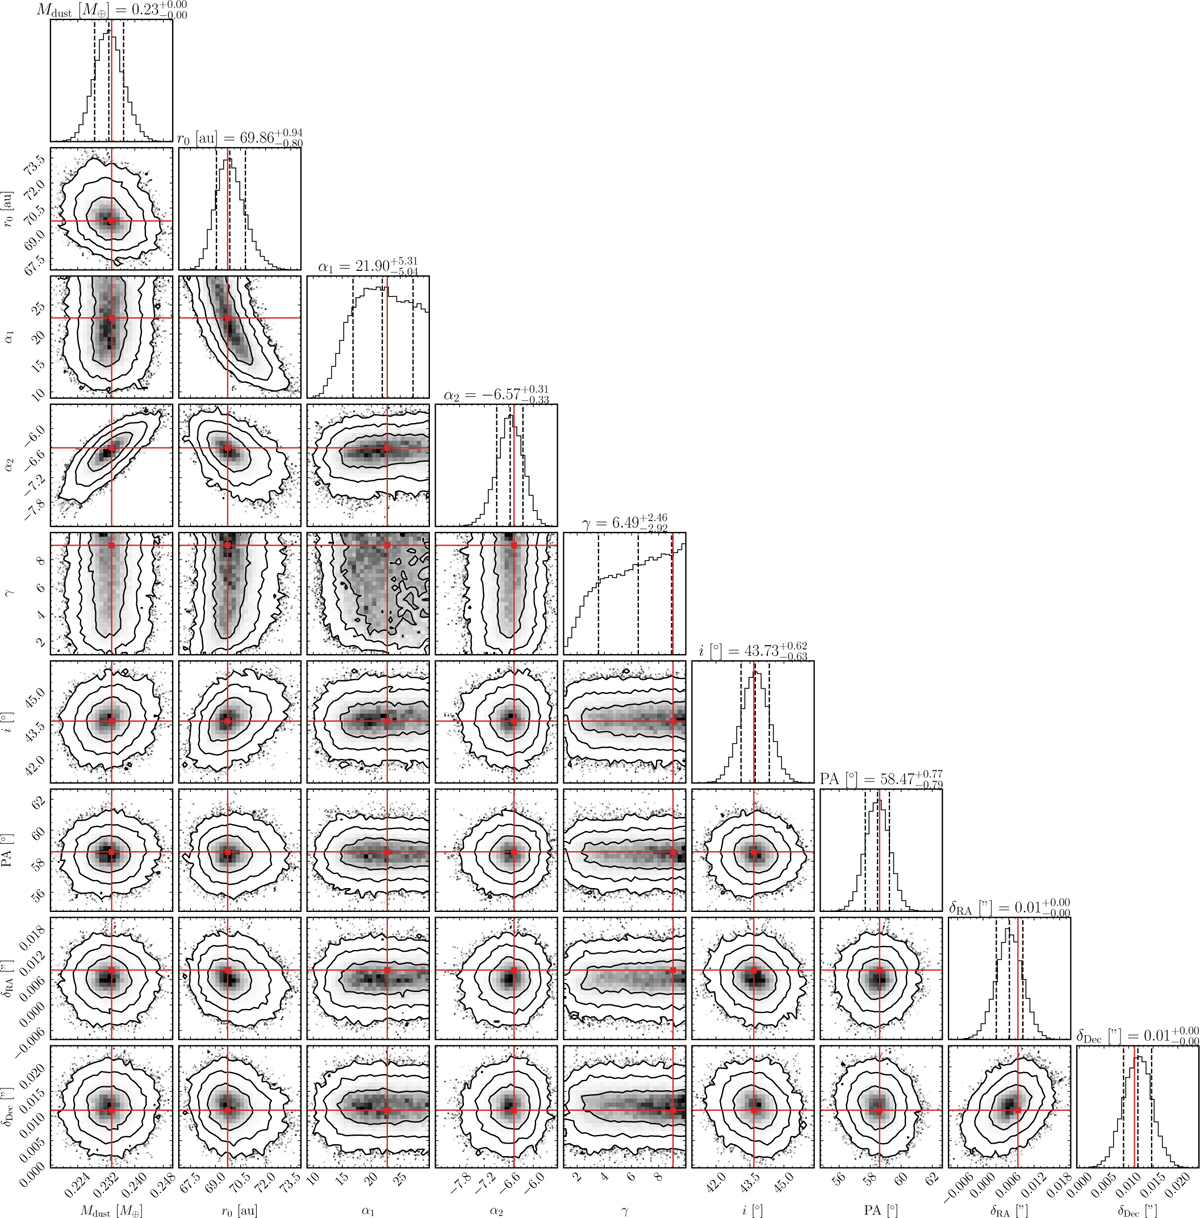
MCMC posterior distribution of the parameters used to fit the dust continuum observations, except those that define the arc. The contour levels in the 2D marginalised distributions correspond to the 68,95, and 99.7% confidence levels. The dashed vertical lines in the marginalised distributions display the 16th, 50th, and 84th percentiles. The red lines represent the best-fit value (lowest χ2).
Current usage metrics show cumulative count of Article Views (full-text article views including HTML views, PDF and ePub downloads, according to the available data) and Abstracts Views on Vision4Press platform.
Data correspond to usage on the plateform after 2015. The current usage metrics is available 48-96 hours after online publication and is updated daily on week days.
Initial download of the metrics may take a while.