Fig. C.1
Download original image
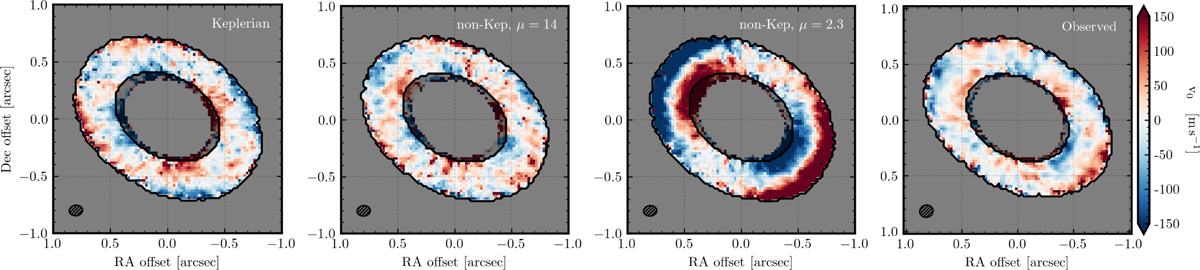
Velocity map residuals after subtracting the best fit line-of-sight Keplerian model from simulated (left, middle left and middle right panels) and the real observations (right panel). The grey-shaded region represents the area that was not included in the fit to avoid low S/N areas. The beam size is displayed in the bottom left corner.
Current usage metrics show cumulative count of Article Views (full-text article views including HTML views, PDF and ePub downloads, according to the available data) and Abstracts Views on Vision4Press platform.
Data correspond to usage on the plateform after 2015. The current usage metrics is available 48-96 hours after online publication and is updated daily on week days.
Initial download of the metrics may take a while.