Fig. 1
Download original image
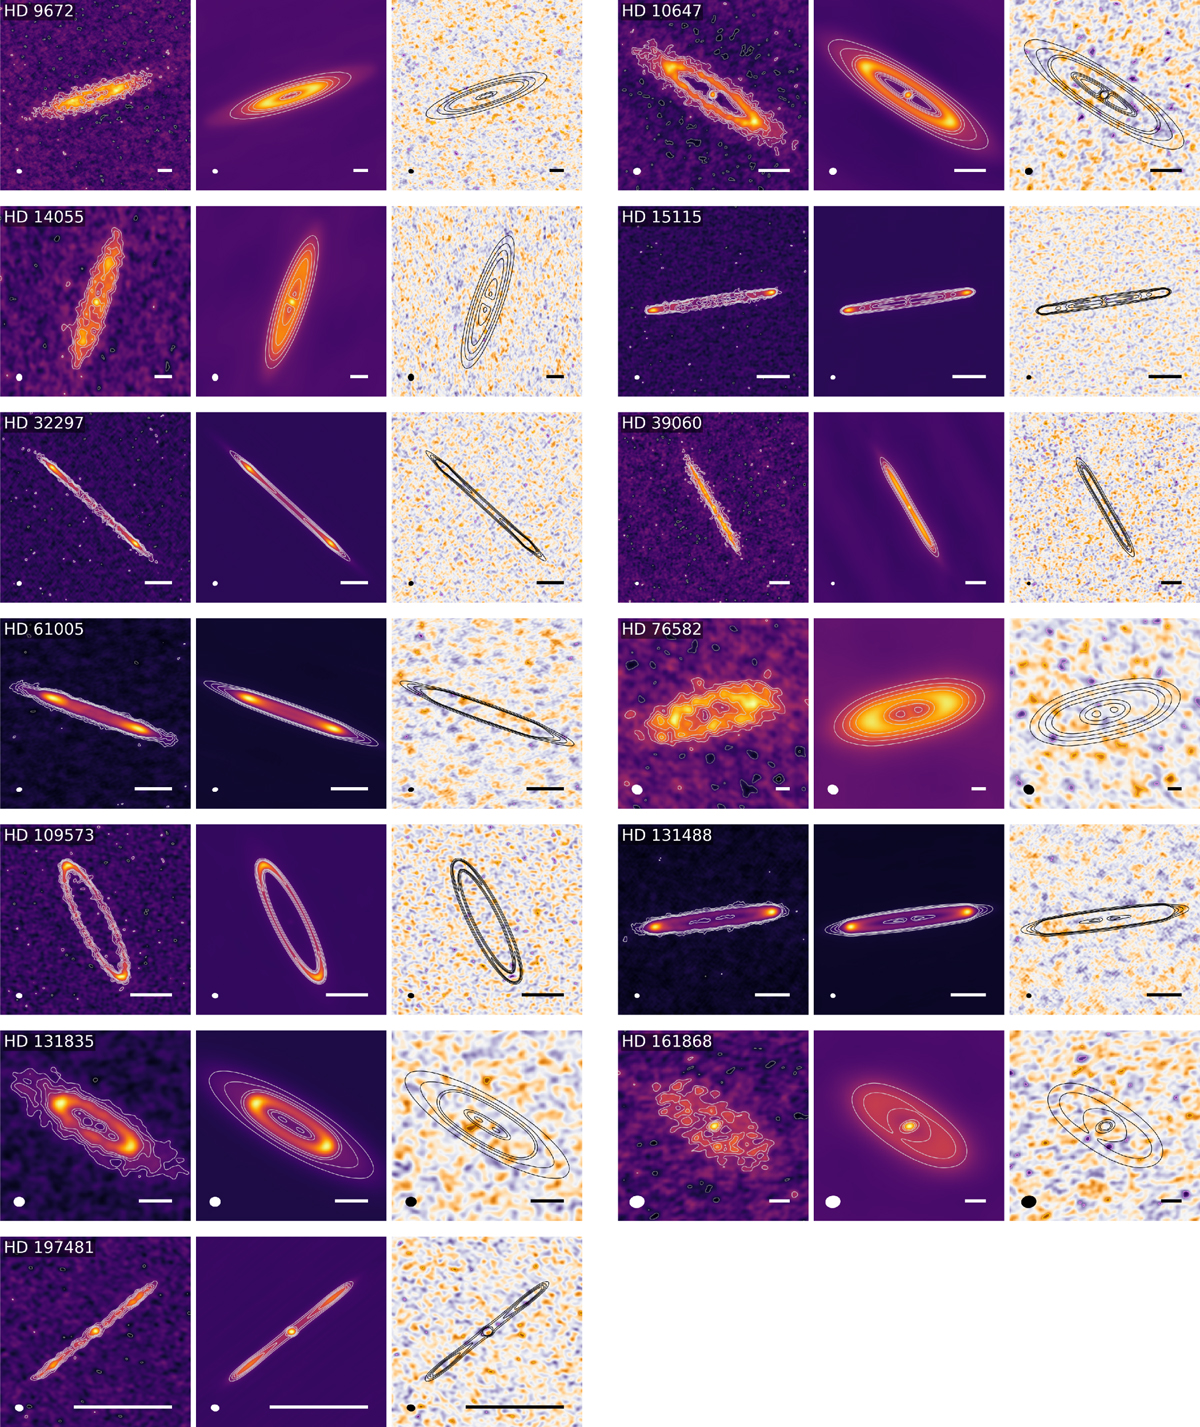
Gallery of the data (left), models (center), and residuals (right, with model contours overplotted for reference) for the fiducial parametric vertical structure models for each source (models shown in Table 2). The effective beam is denoted by the shaded ellipse in the bottom-left corner of each panel, and the scale bars in the bottom right of each panel are 50 au in length. In the data and model panels, contours show three, five, seven, and nine times the rms (positive in light gray, negative in dark gray). In the residual panels, the purple and orange contours show +3 and −3 times the rms, respectively, though none of the sources show significant structure in the residuals. For each source, the data and model images are plotted on the same color scale, which spans the full dynamic range of each data image.
Current usage metrics show cumulative count of Article Views (full-text article views including HTML views, PDF and ePub downloads, according to the available data) and Abstracts Views on Vision4Press platform.
Data correspond to usage on the plateform after 2015. The current usage metrics is available 48-96 hours after online publication and is updated daily on week days.
Initial download of the metrics may take a while.