Fig. B.2
Download original image
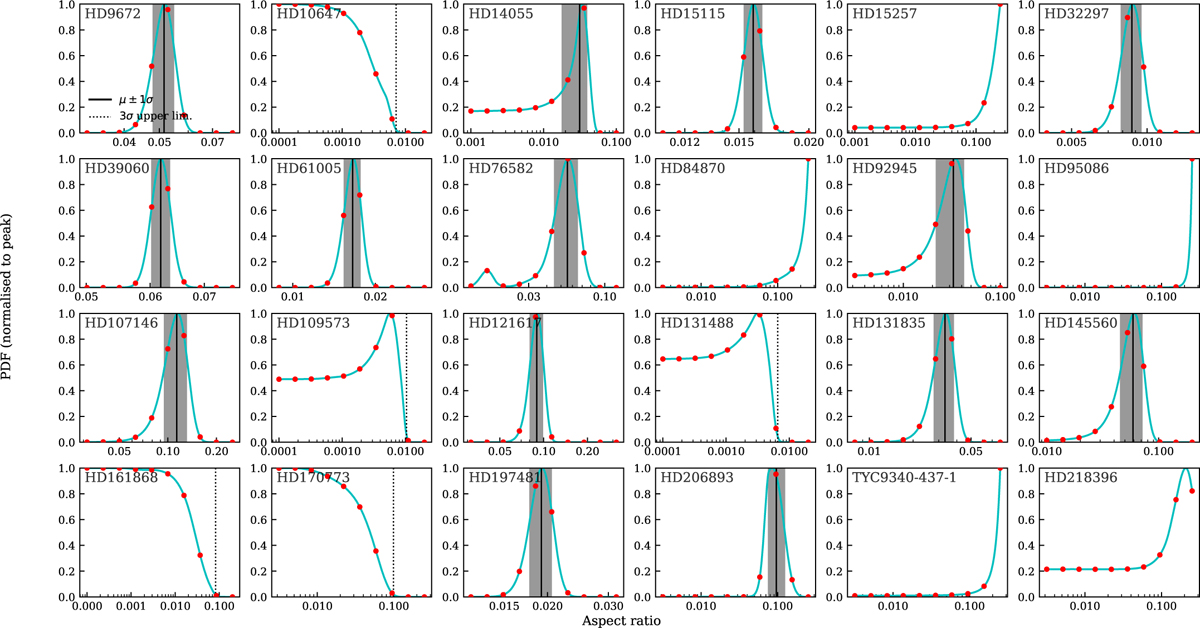
Probability density distributions of hσ fitted with frank. The red dots indicate sample points where the frank model was fitted and the squared residuals computed, based on which the distribution was interpolated to obtain the cyan lines. The vertical solid black lines and shaded region indicate the median and 1σ uncertainty region for distributions with a clear peak, whereas black dotted lines indicate the 3σ upper limit for disks where only an upper limit can be placed.
Current usage metrics show cumulative count of Article Views (full-text article views including HTML views, PDF and ePub downloads, according to the available data) and Abstracts Views on Vision4Press platform.
Data correspond to usage on the plateform after 2015. The current usage metrics is available 48-96 hours after online publication and is updated daily on week days.
Initial download of the metrics may take a while.