Fig. C.1
Download original image
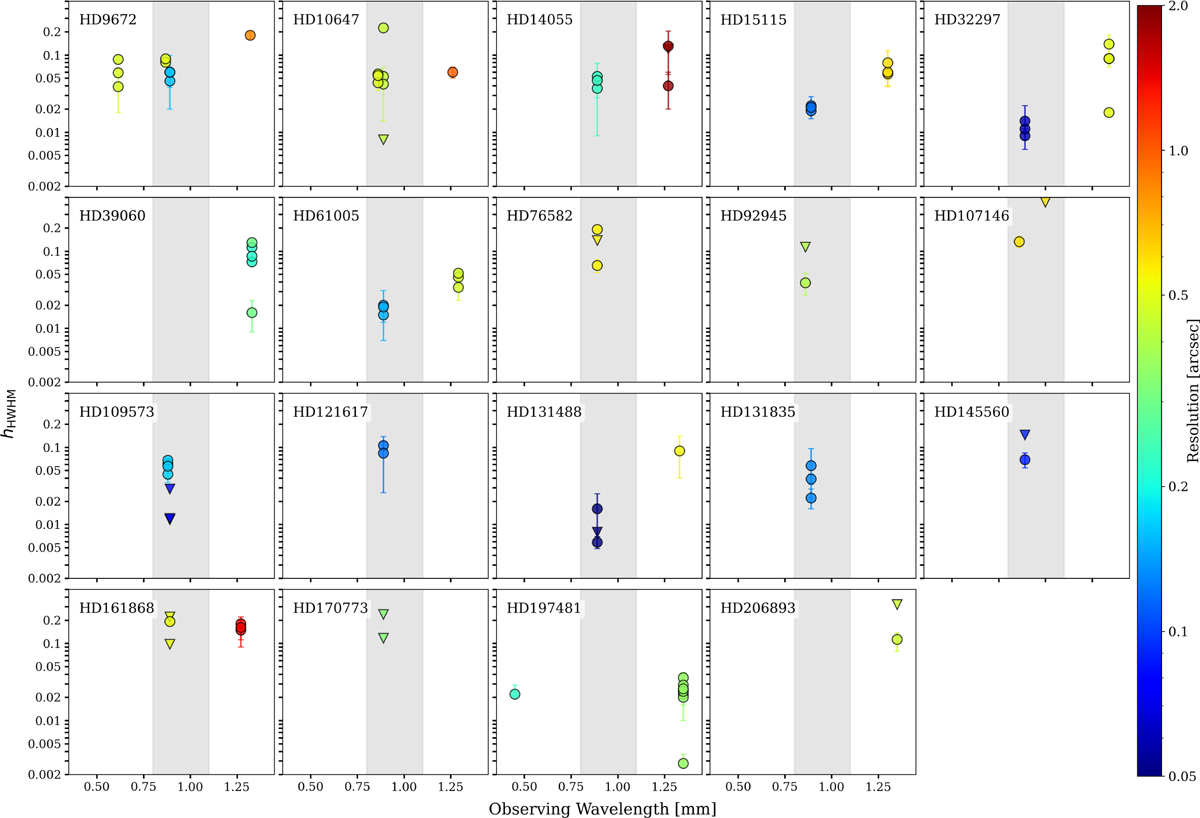
All values of hHWHM measured in this work and previous studies (Table C.1) with respect to observing wavelength. The gray shaded region shows the wavelength range of ALMA Band 7. The color bar shows the angular resolution of the observations used for each measurement. Triangular points indicate measurements which are upper limits, while circular points show the upper and lower 1σ uncertainties associated with the measurement.
Current usage metrics show cumulative count of Article Views (full-text article views including HTML views, PDF and ePub downloads, according to the available data) and Abstracts Views on Vision4Press platform.
Data correspond to usage on the plateform after 2015. The current usage metrics is available 48-96 hours after online publication and is updated daily on week days.
Initial download of the metrics may take a while.