Fig. 2
Download original image
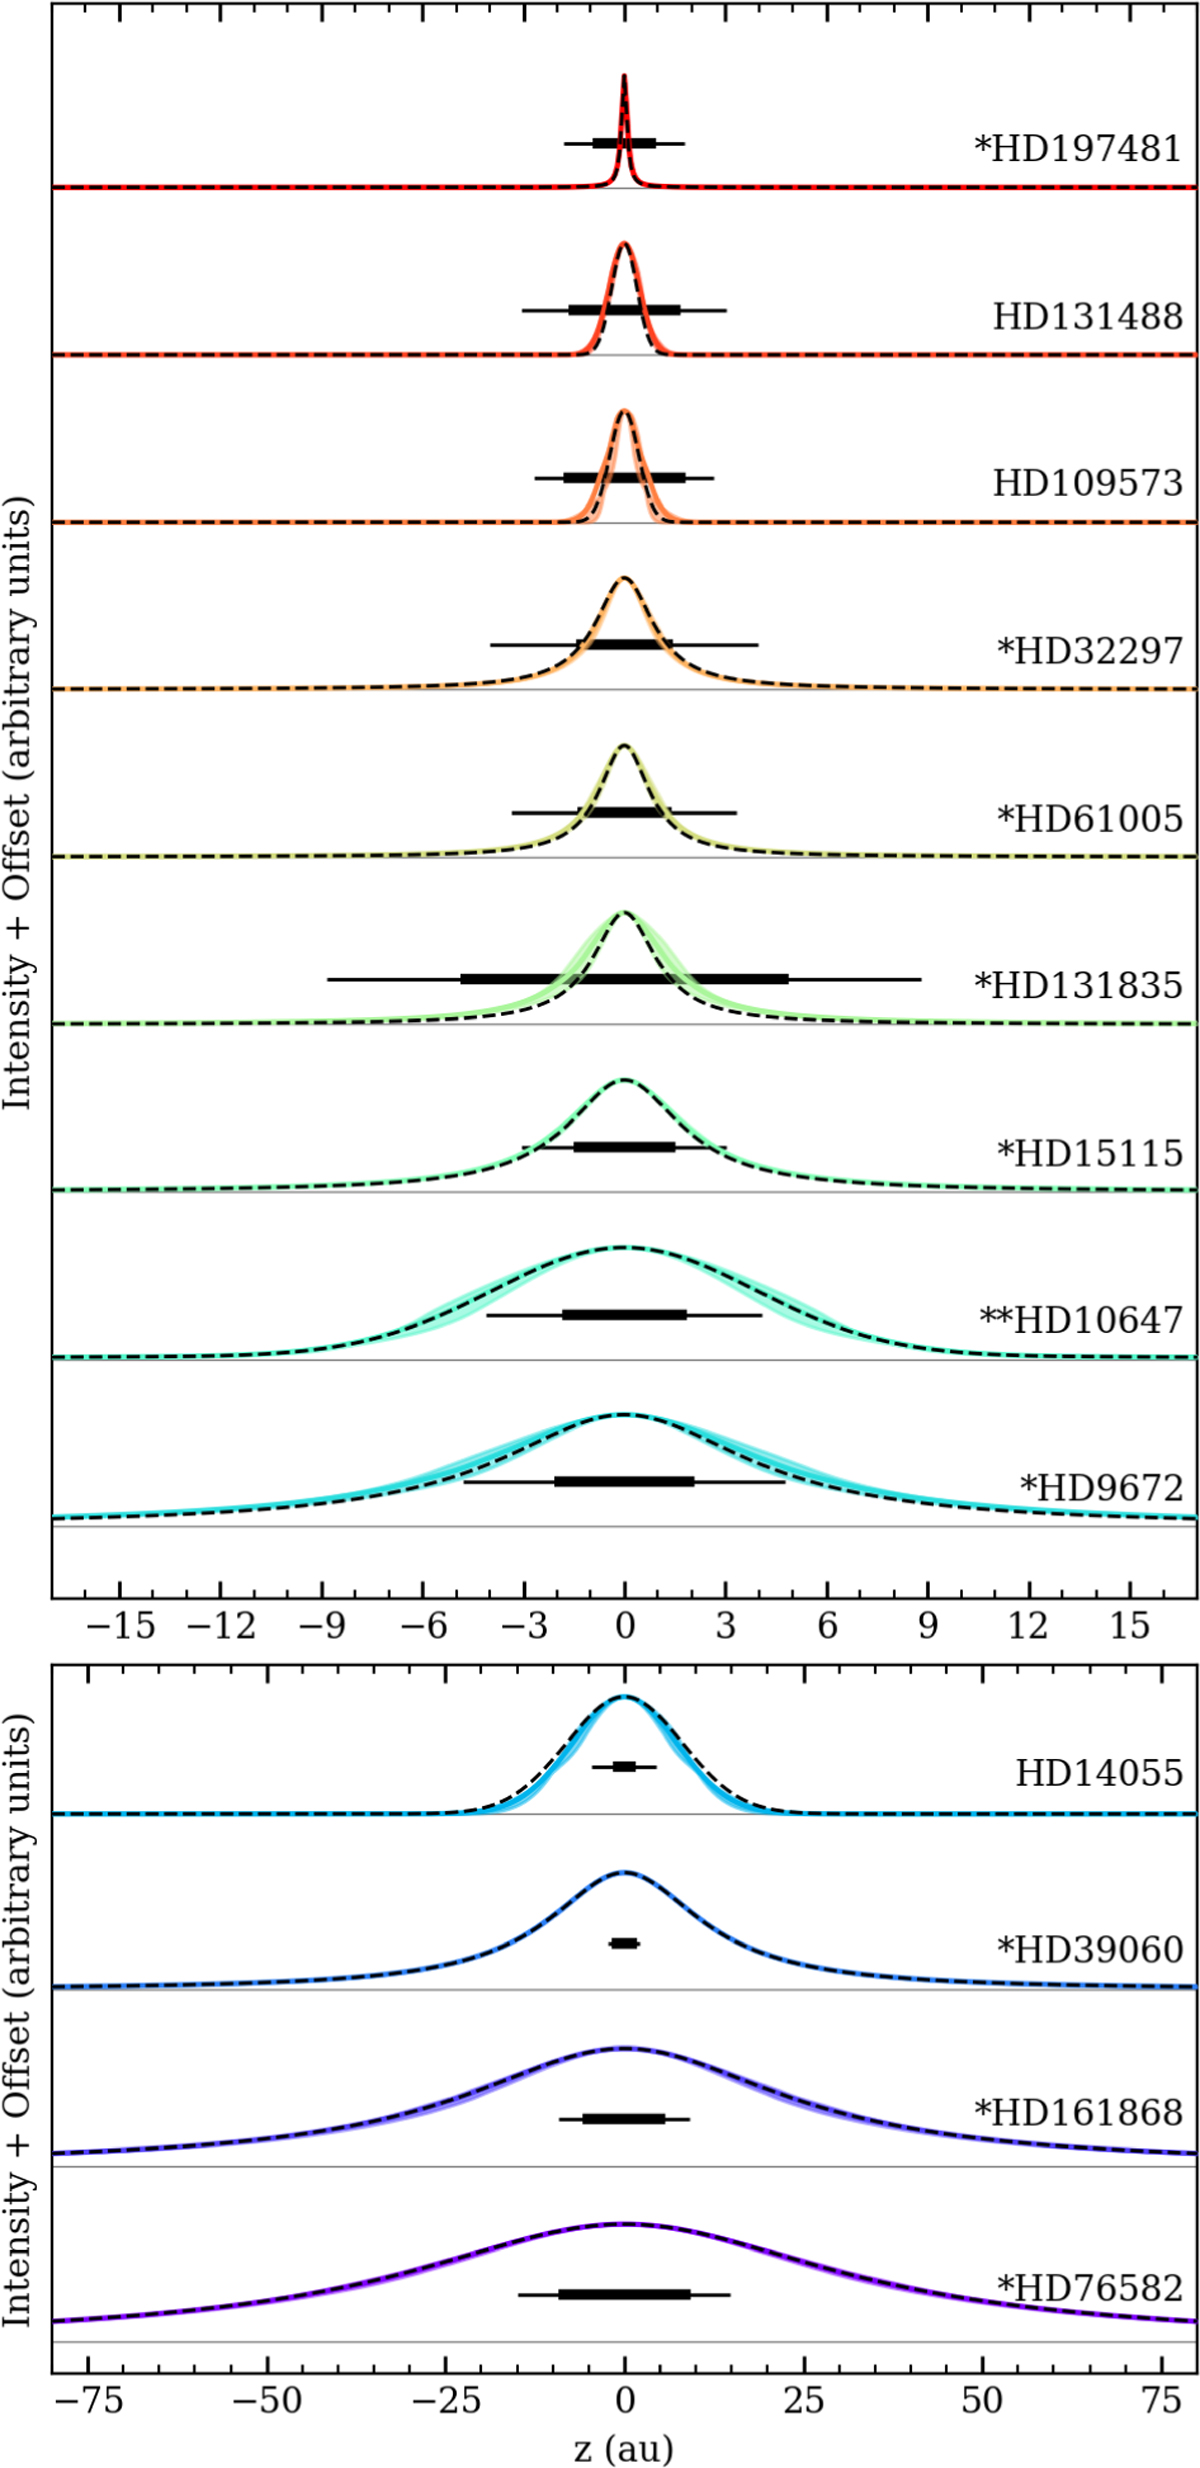
Comparison of the fiducial vertical profiles for each disk at the reference radius Rref, defined as the location of peak intensity in the fiducial model (Table 4). Sources are ordered by HHWHM(Rref) and divided into two panels for visual clarity, with disks with HHWHM(Rref) < 15 au in the top panel and disks with HHWHM(Rref) > 15 au in the bottom panel. We denote extended or multi-component vertical profiles with asterisks (one asterisk for a Lorentzian profile, and two asterisks for a double Gaussian vertical profile). The remaining sources have Gaussian vertical profiles. Colored lines and the shaded regions denote the median profile ±1σ, while the dashed black lines show the best-fit model. The thick horizontal black bars show the nominal resolution of the interferometer, λobs/bmax, where λobs is the observing wavelength and bmax is the longest baseline in the array. The thin horizontal black bars show the width of one beam along the vertical axis of the disk using the images shown in Figure 1.
Current usage metrics show cumulative count of Article Views (full-text article views including HTML views, PDF and ePub downloads, according to the available data) and Abstracts Views on Vision4Press platform.
Data correspond to usage on the plateform after 2015. The current usage metrics is available 48-96 hours after online publication and is updated daily on week days.
Initial download of the metrics may take a while.