Fig. 6
Download original image
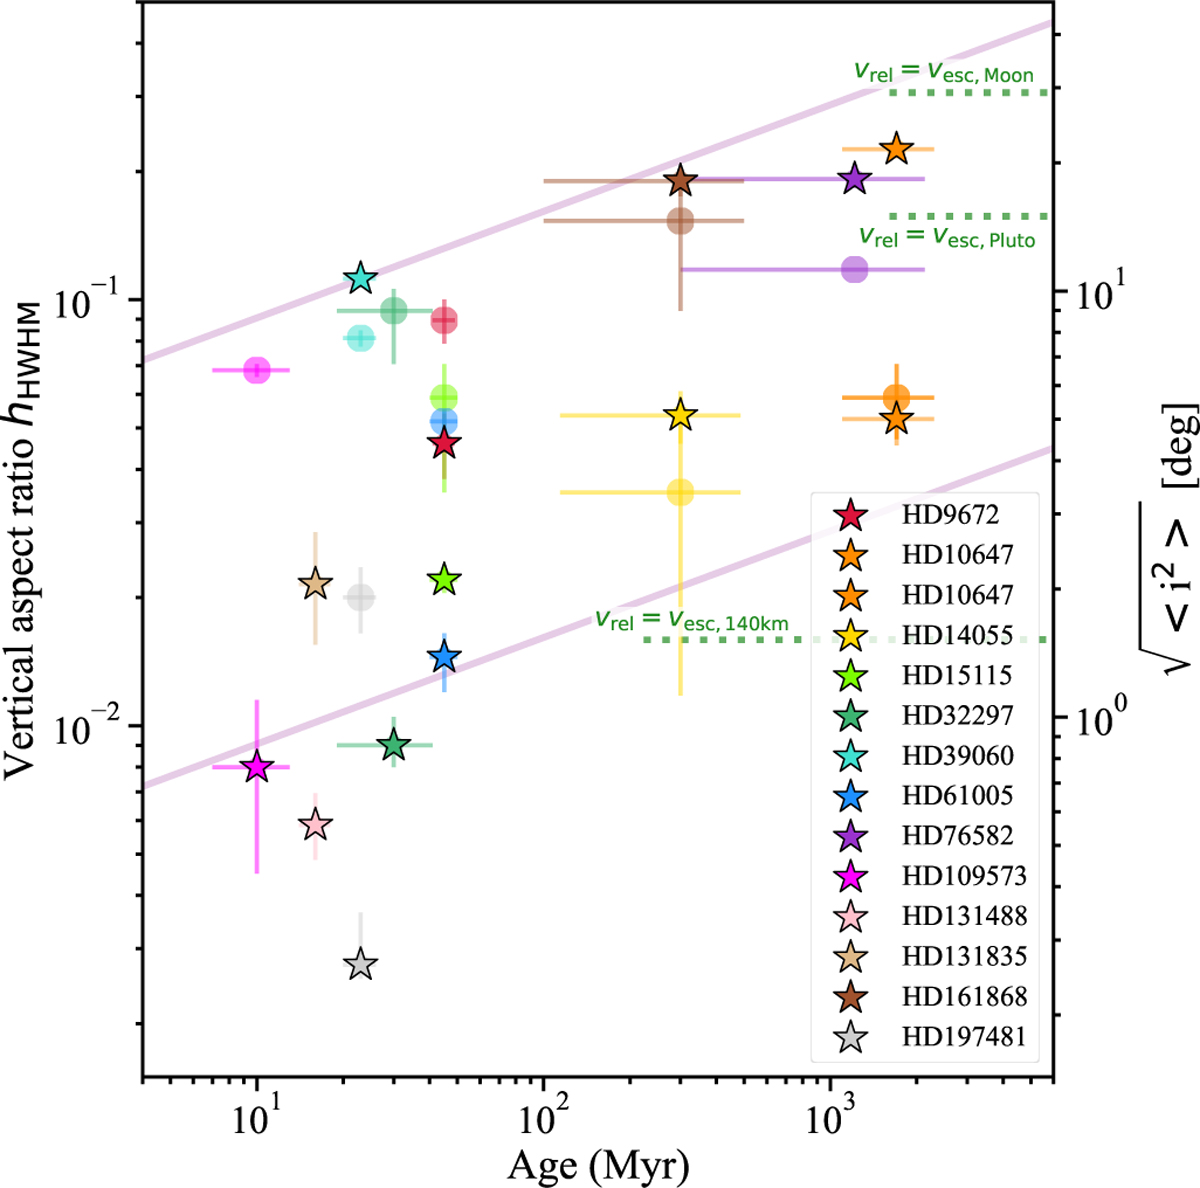
Aspect ratio hHWHM of the vertical profiles measured for the ARKS data (stars) compared to the values derived from the REASONS survey (circles, Matrà et al. 2025) with respect to host star age. ARKS values are the best-fit values presented in Table 2; we note that for HD 10647, two aspect ratios are plotted because the best-fit model is composed of a vertical double Gaussian with two measured aspect ratios. The corresponding rms inclination of dust grains assuming a Rayleigh distribution of inclinations is shown on the right y axis. Purple lines show the ![]() increase with age expected for planetesimal belts stirred by large bodies (assuming that stirring bodies form early; Ida & Makino 1993), with mass × surface density
increase with age expected for planetesimal belts stirred by large bodies (assuming that stirring bodies form early; Ida & Makino 1993), with mass × surface density ![]() au2 (top) and
au2 (top) and ![]() au2 (bottom). Green dotted lines represent the maximum rms inclinations expected from Moon-like, Pluto-like, and 140 km-sized stirring bodies (assuming the median stellar host mass and belt radius of the REASONS sample, Matrà et al. 2025).
au2 (bottom). Green dotted lines represent the maximum rms inclinations expected from Moon-like, Pluto-like, and 140 km-sized stirring bodies (assuming the median stellar host mass and belt radius of the REASONS sample, Matrà et al. 2025).
Current usage metrics show cumulative count of Article Views (full-text article views including HTML views, PDF and ePub downloads, according to the available data) and Abstracts Views on Vision4Press platform.
Data correspond to usage on the plateform after 2015. The current usage metrics is available 48-96 hours after online publication and is updated daily on week days.
Initial download of the metrics may take a while.