Fig. 2
Download original image
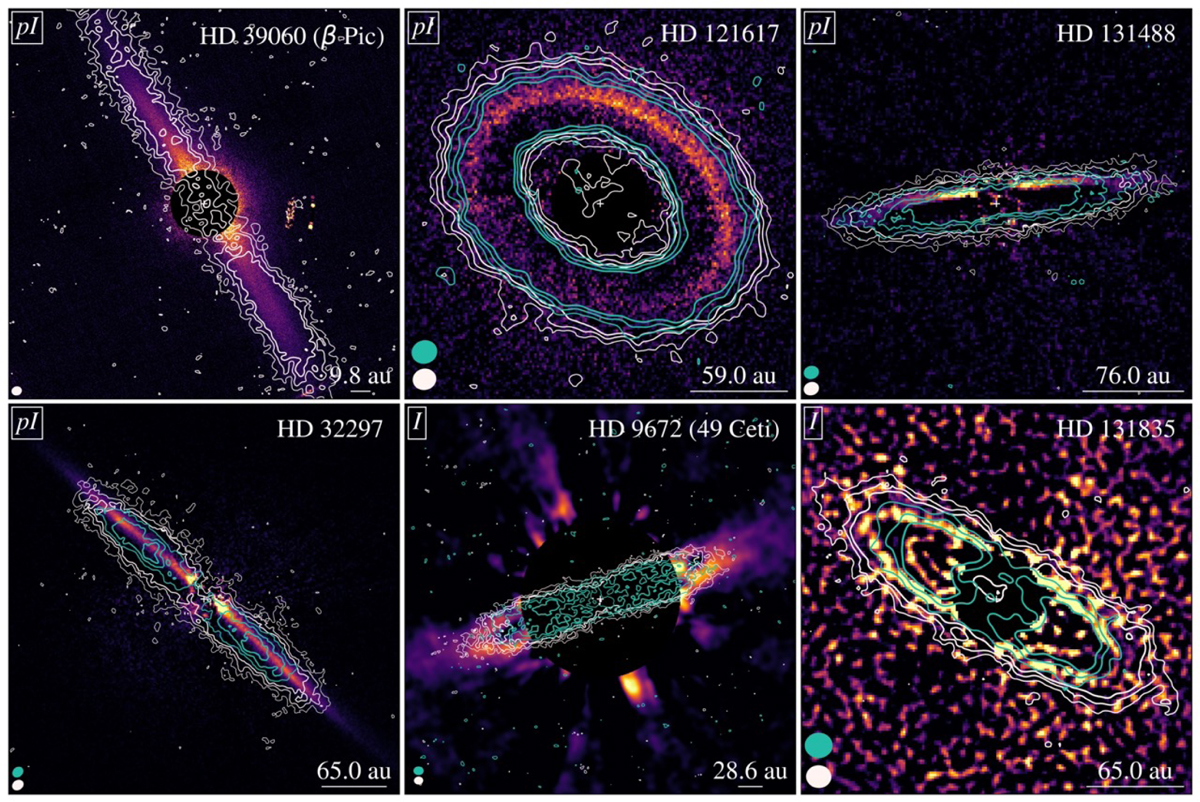
Discs from the ARKS sample that have gas detections. The scattered light observations are the same as in Fig. 1. Overlaid on the scattered light images are the moment 0 maps for the gas observed with ALMA, using the robust values shown in Mac Manamon et al. (2026), i.e. 0.5 for β Pictoris, HD 121617, 49 Ceti, HD 131835 and 2.0 for HD 131488 and HD 32297. The 12CO (J=3–2 line) is plotted in white and the 13CO (J=3–2 line) in green, with the exception of β Pictoris where only the 12CO (J=2–1 line) is plotted, as this disc is not detected in 13CO. For every disc, there are 3 contour levels, corresponding to 3, 5, and 7 σ. The ellipses at the bottom left (white for 12CO and green for 13CO) represent the beam size for the ALMA observations. In all panels, North is up, East to the left.
Current usage metrics show cumulative count of Article Views (full-text article views including HTML views, PDF and ePub downloads, according to the available data) and Abstracts Views on Vision4Press platform.
Data correspond to usage on the plateform after 2015. The current usage metrics is available 48-96 hours after online publication and is updated daily on week days.
Initial download of the metrics may take a while.