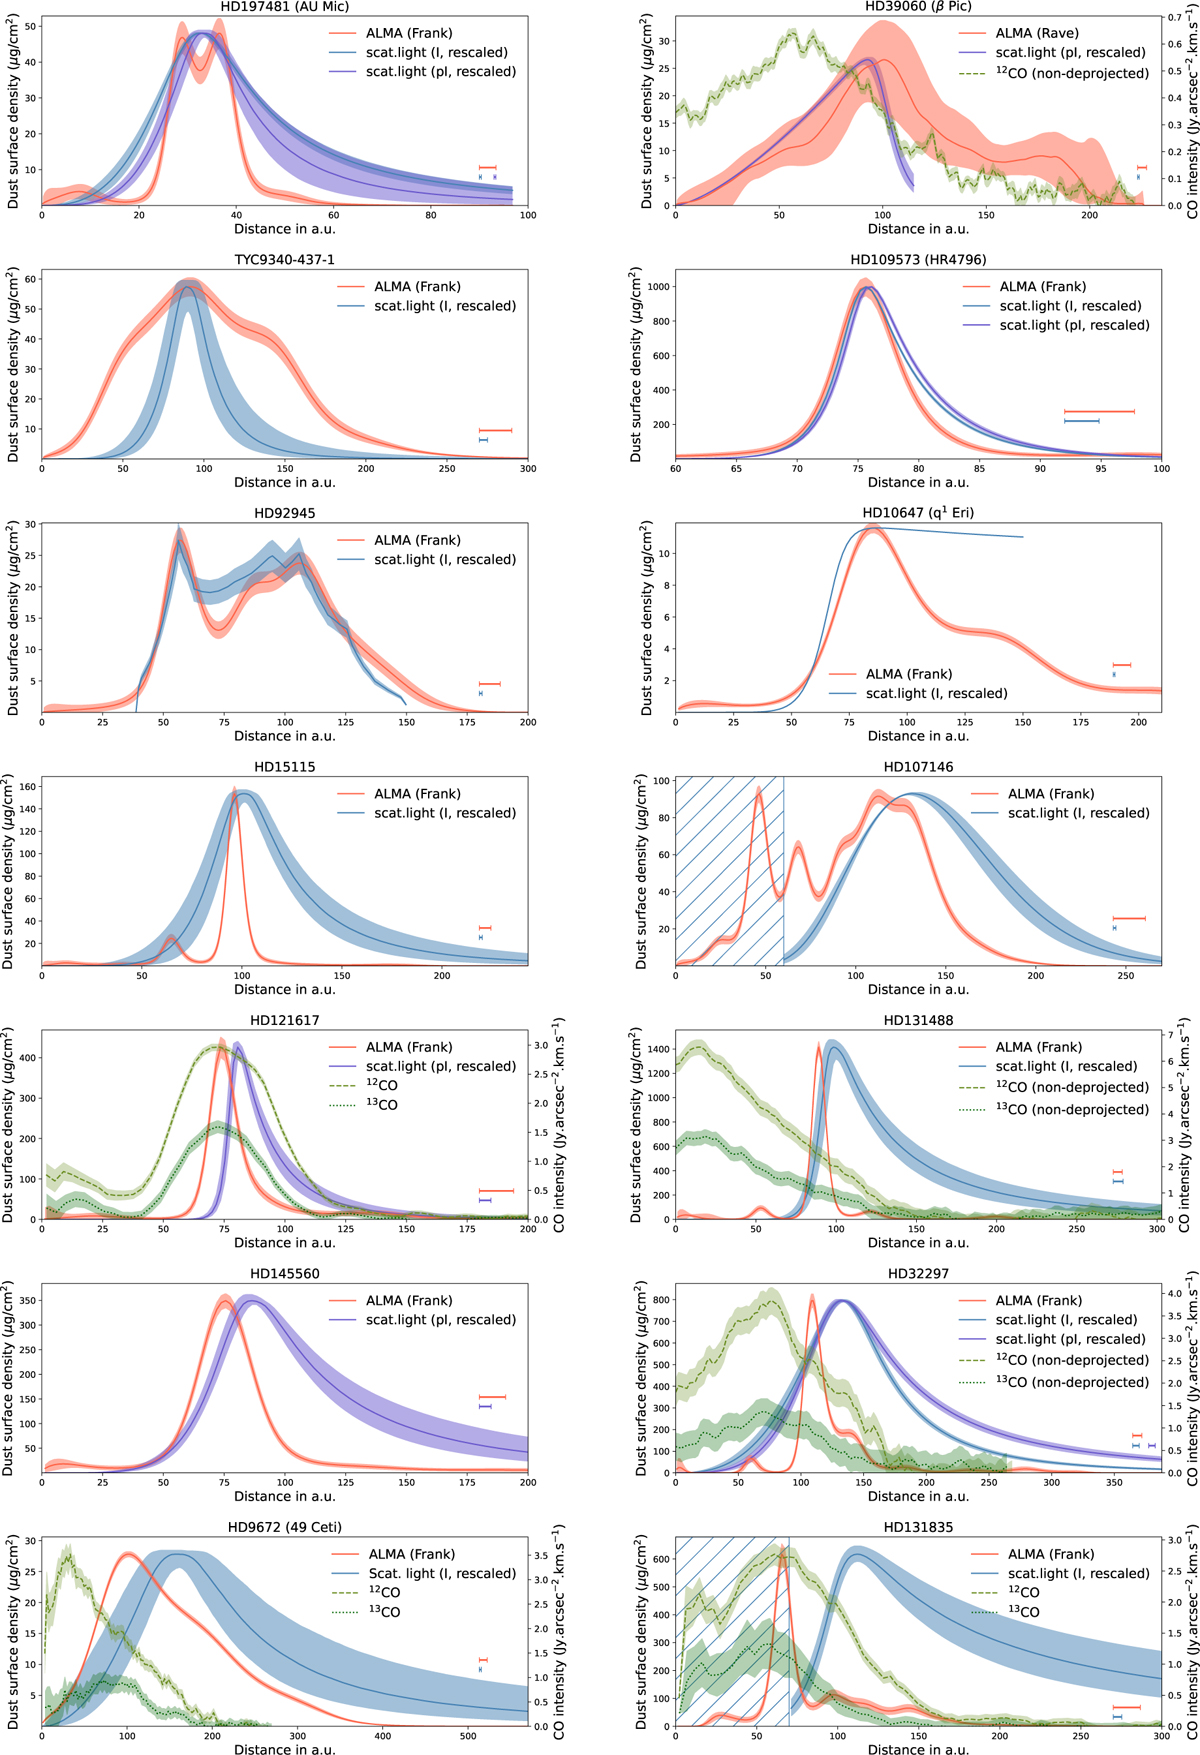
Fig. 3
Download original image
Comparison of the dust surface densities extracted from the ALMA continuum image and from the scattered light image in total intensity (I) or polarised intensity (pI). The scattered light profiles are rescaled to the ALMA profiles for display. For systems with CO detected, the 12CO or 13CO intensity profile is overplotted. Blue hatched regions correspond to inner regions where no scattered light modelling could be performed. The scale in the bottom right-hand corner in each panel indicates the ALMA and scattered light image resolution.
Current usage metrics show cumulative count of Article Views (full-text article views including HTML views, PDF and ePub downloads, according to the available data) and Abstracts Views on Vision4Press platform.
Data correspond to usage on the plateform after 2015. The current usage metrics is available 48-96 hours after online publication and is updated daily on week days.
Initial download of the metrics may take a while.