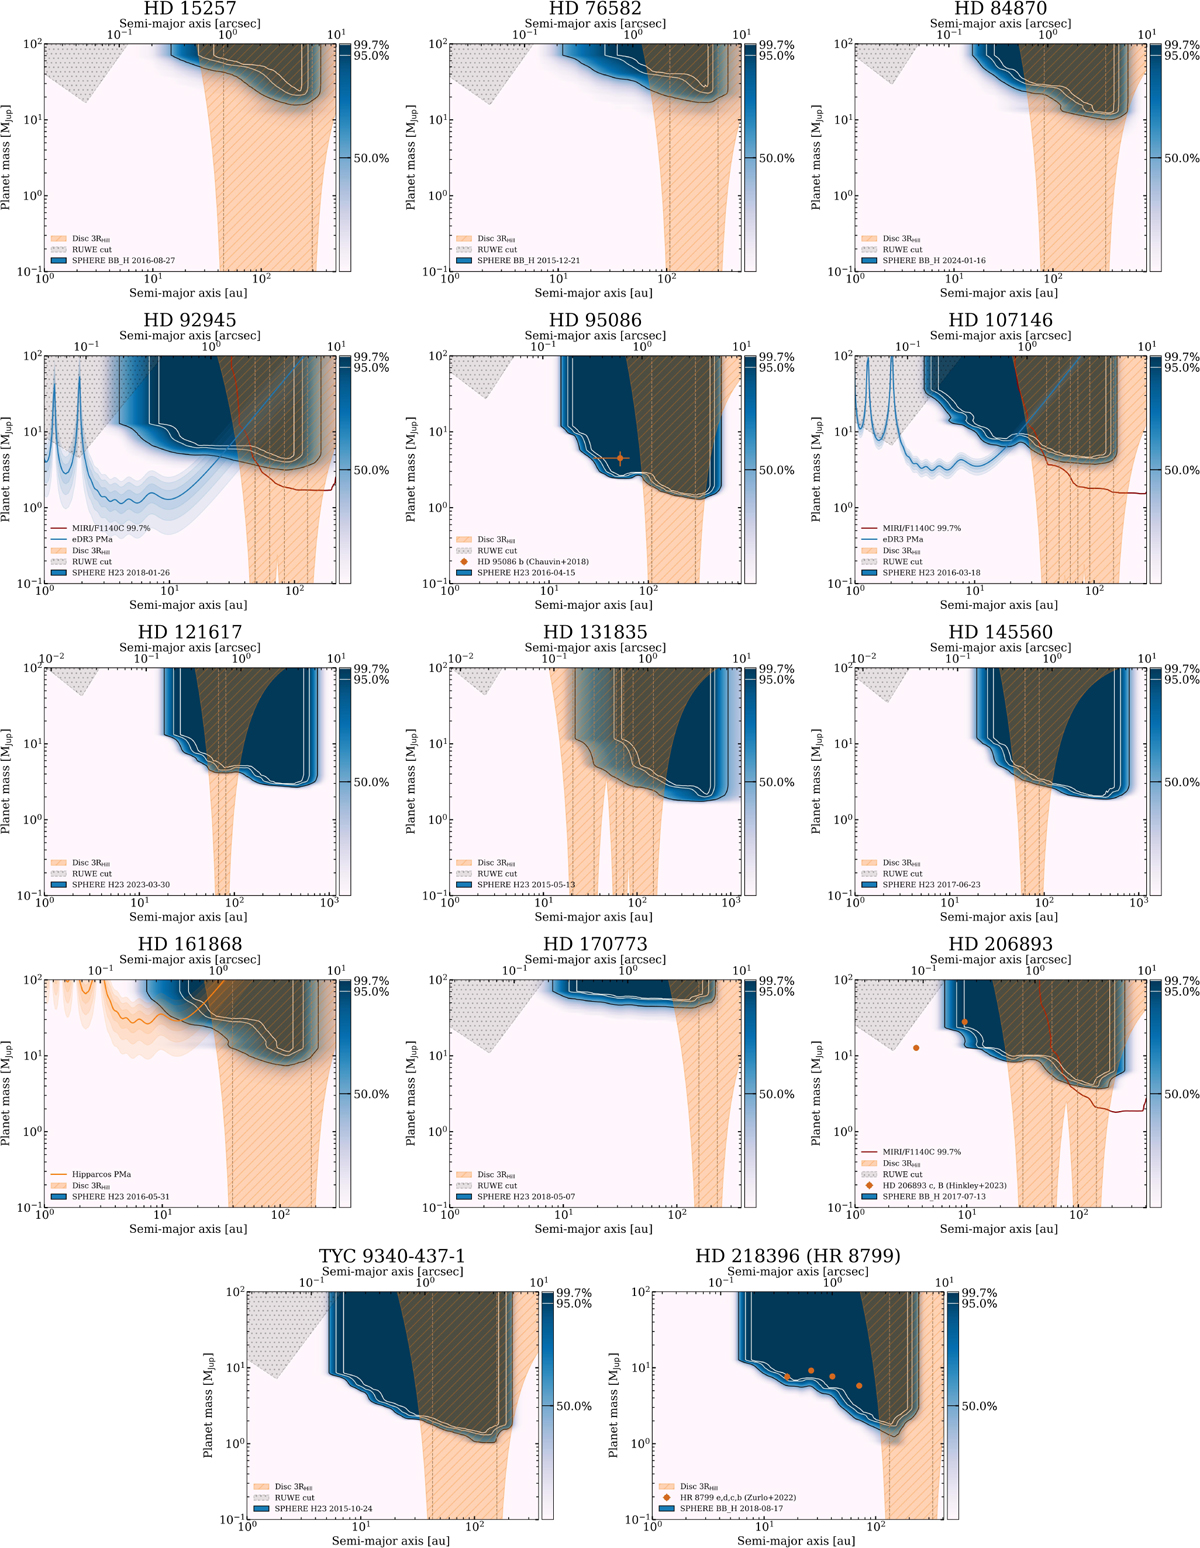
Fig. 5
Download original image
SPHERE DPMs for the moderately inclined systems. The blue regions with contours at 99.7%, 95%, and 50% indicate the probability of detecting a planet at a 5σ level with SPHERE. For three systems, HD 92945, HD 107146, and HD 206893, the 99.7% JWST/MIRI F1140C contour is shown in red for comparison. The orange hatched areas denote the 3RHill regions from the disc edges, where 1RHill is defined as Eq. (1). Constraints from Gaia RUWE are indicated by grey dotted regions. The light blue curve marks the mass and location of a planet required to explain the significant proper motion anomaly. In systems with known planets, their positions are shown as orange dots.
Current usage metrics show cumulative count of Article Views (full-text article views including HTML views, PDF and ePub downloads, according to the available data) and Abstracts Views on Vision4Press platform.
Data correspond to usage on the plateform after 2015. The current usage metrics is available 48-96 hours after online publication and is updated daily on week days.
Initial download of the metrics may take a while.