Fig. 1
Download original image
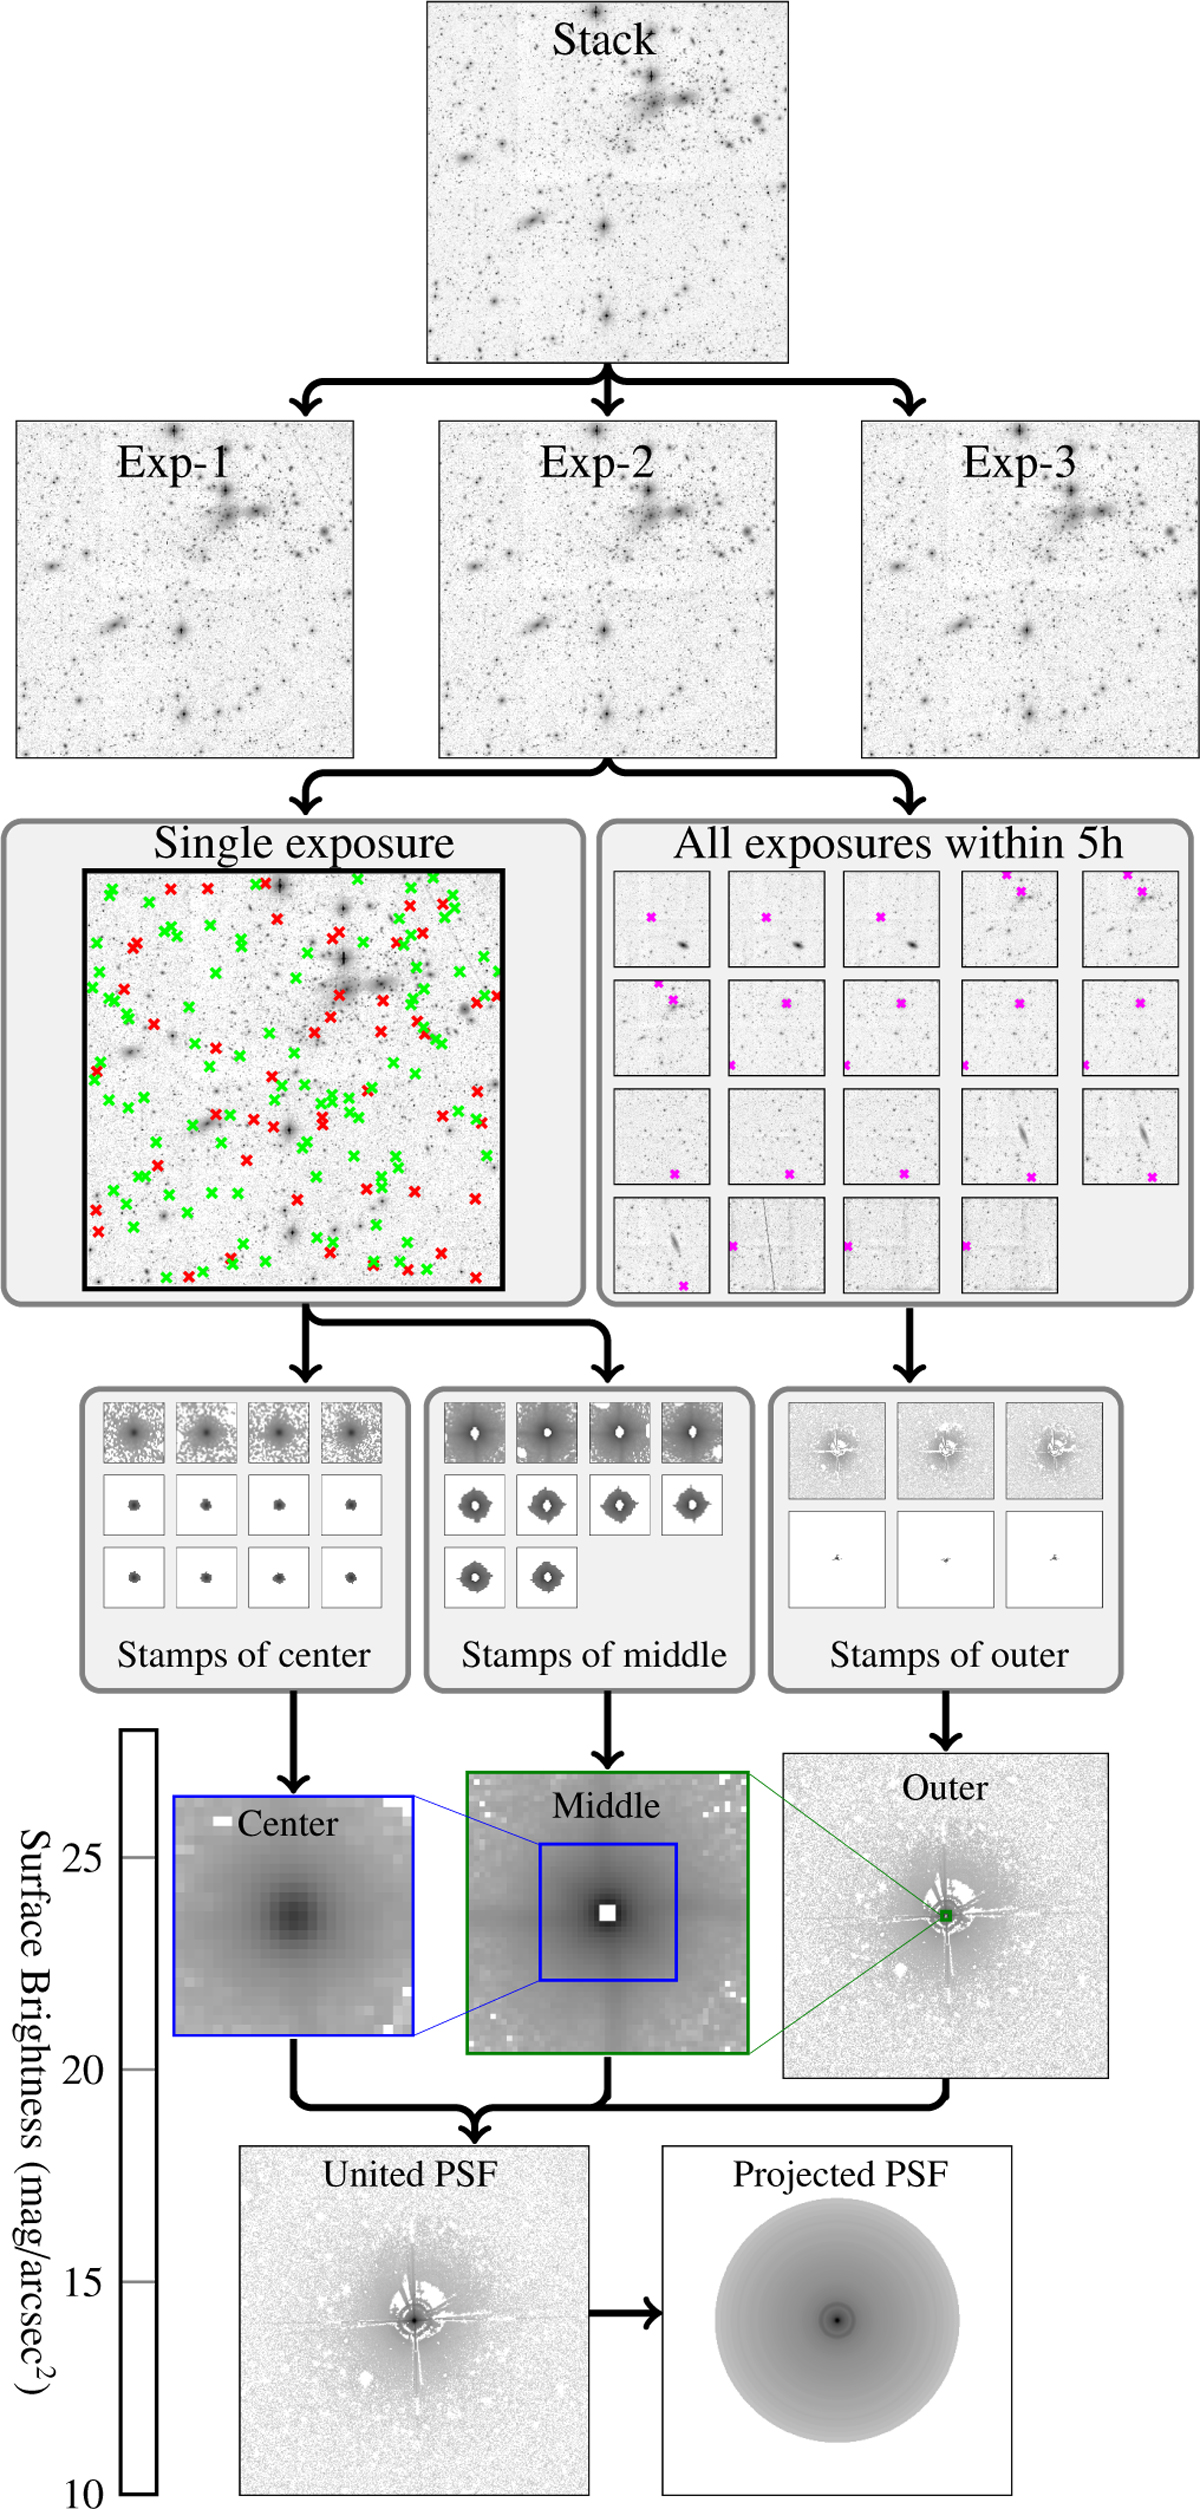
Flow chart of extended the PSF construction for a J-PLUS tile. All images are scaled to the color bar at the bottom. The top row shows the coadded image of three exposures which are shown in second row and the second row shows the three exposures that were used to build it. The third row shows the exposure(s) used for the various parts of the PSF in the second exposure of the second row: the single exposure itself for the center and middle parts and all exposures ±2.5 hours before and after the exposure for the outer part. The marked green and red stars are used for creating central (Sect. 2.2) and middle parts (Sect. 2.3), respectively. The stars under pink crosses (on the right) are used to create the outer PSF (Sect. 2.4). The fourth row presents a selection of the star stamps, with other sources masked, while the fifth row displays the coadded stamps. These are subsequently combined to construct the “Unified PSF,” shown in the final row. Its 1D radial profile up to 9.17 arcmin (in radius) is then projected into the circular “Projected PSF.” The surface brightness of the united PSF (from the central pixel to outer) changes about 15 mag arcsec−2 (See Sect. 2.5).
Current usage metrics show cumulative count of Article Views (full-text article views including HTML views, PDF and ePub downloads, according to the available data) and Abstracts Views on Vision4Press platform.
Data correspond to usage on the plateform after 2015. The current usage metrics is available 48-96 hours after online publication and is updated daily on week days.
Initial download of the metrics may take a while.