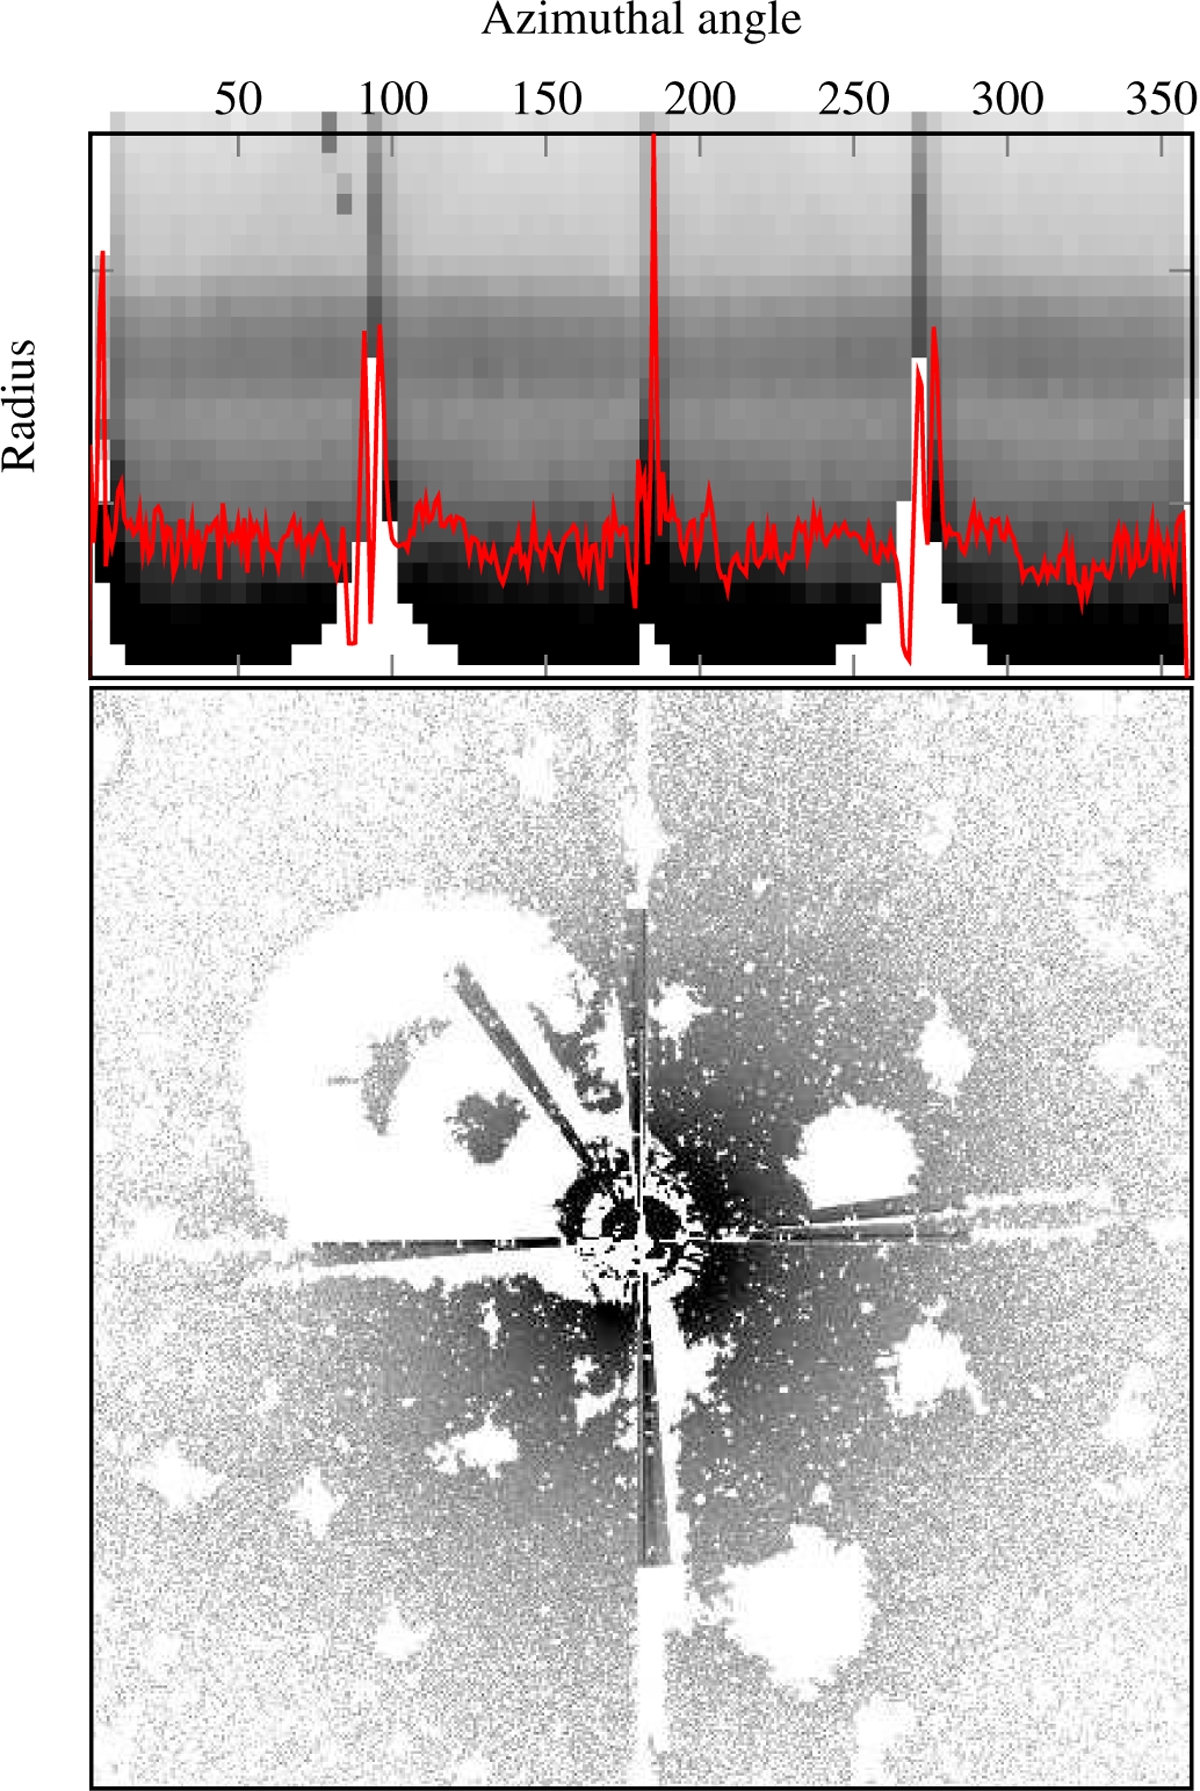
Fig. B.1
Download original image
Unmasking of the spikes in the image of bright stars using polar plots. The top panel shows the output of the polar plot. The x-axis shows the azimuthal angle, and y-axis shows the radius. The white pixels were originally bleeding pixels. The red profile shows the collapsed value at each azimuthal angle. Based on this plot, the angle of the spike was extracted and removed from the masked pixels, shown in Fig. 5(e).
Current usage metrics show cumulative count of Article Views (full-text article views including HTML views, PDF and ePub downloads, according to the available data) and Abstracts Views on Vision4Press platform.
Data correspond to usage on the plateform after 2015. The current usage metrics is available 48-96 hours after online publication and is updated daily on week days.
Initial download of the metrics may take a while.