Open Access
Fig. 3
Download original image
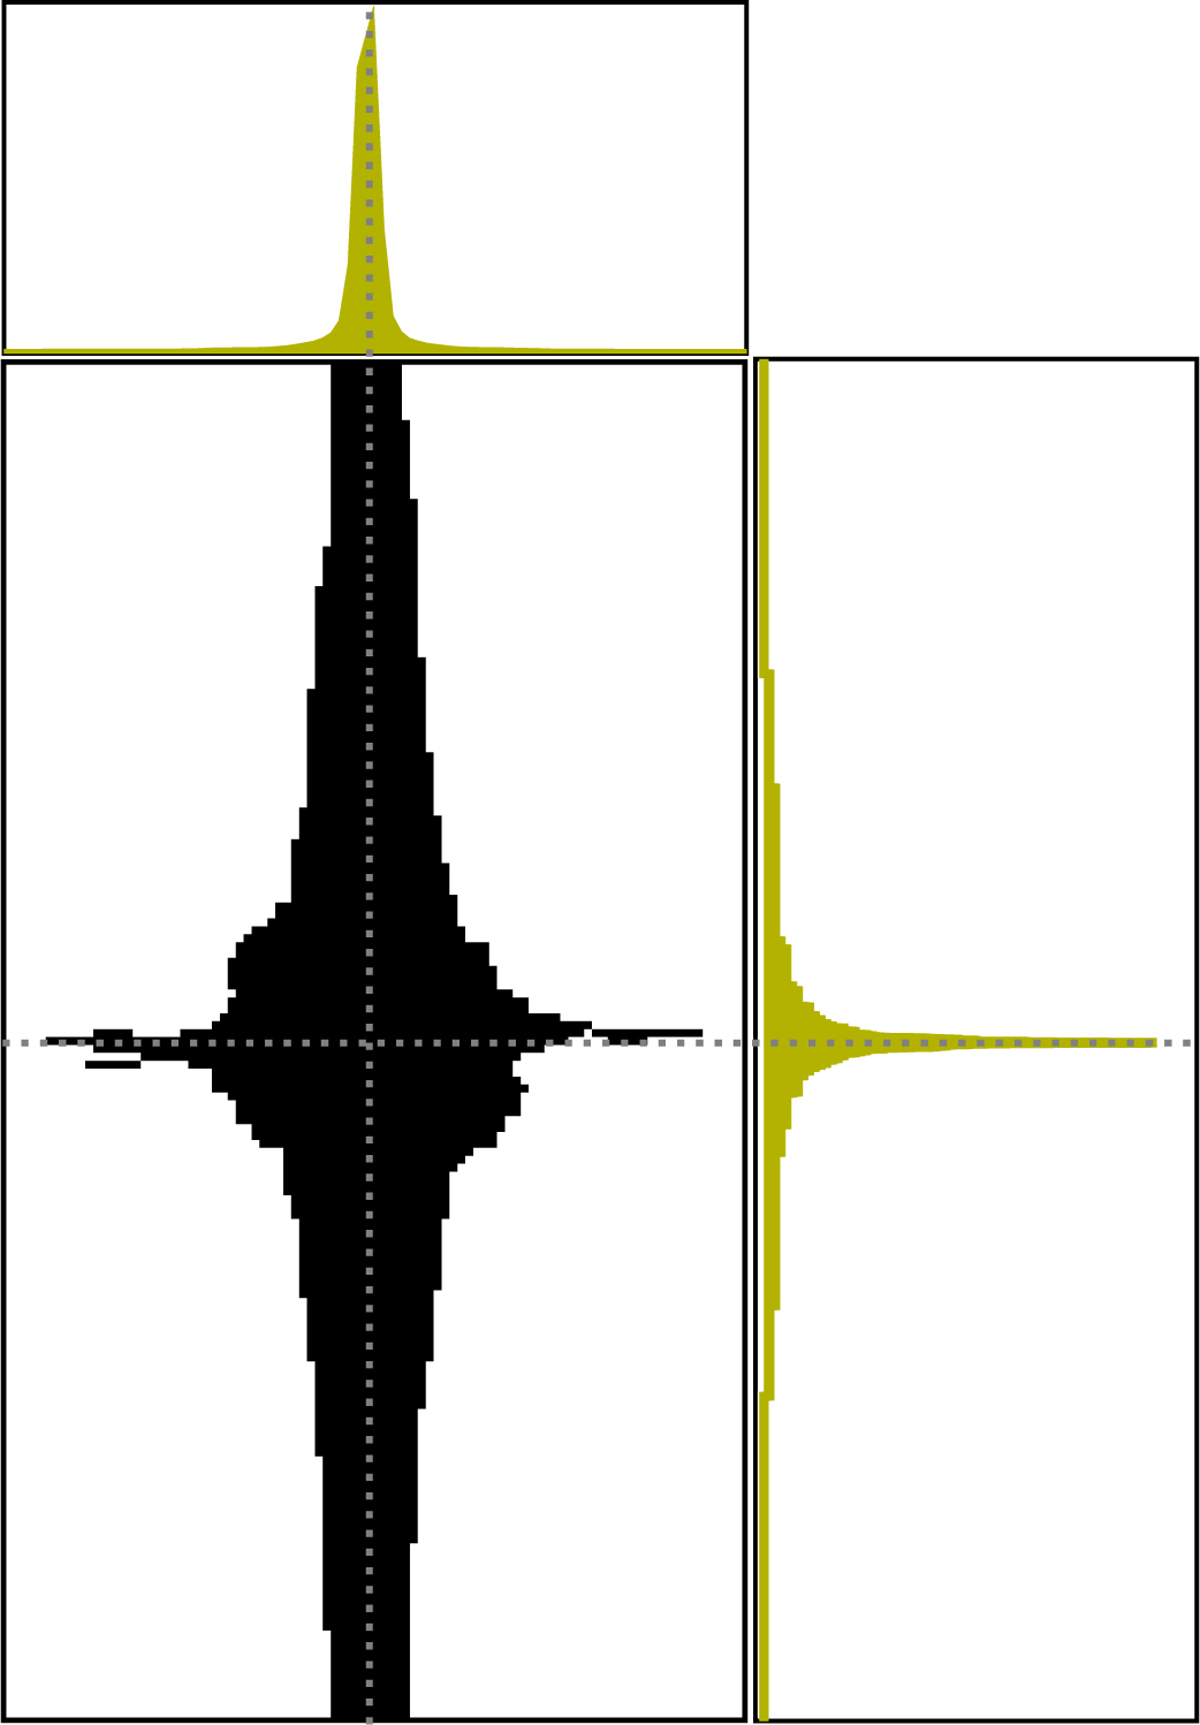
Finding the center of saturated stars from the bleeding pixels (black in the bottom-left panel). After collapsing the pixels along the X and Y axes, the peak of the distribution shows the center coordinate of the saturated star.
Current usage metrics show cumulative count of Article Views (full-text article views including HTML views, PDF and ePub downloads, according to the available data) and Abstracts Views on Vision4Press platform.
Data correspond to usage on the plateform after 2015. The current usage metrics is available 48-96 hours after online publication and is updated daily on week days.
Initial download of the metrics may take a while.