Fig. 1
Download original image
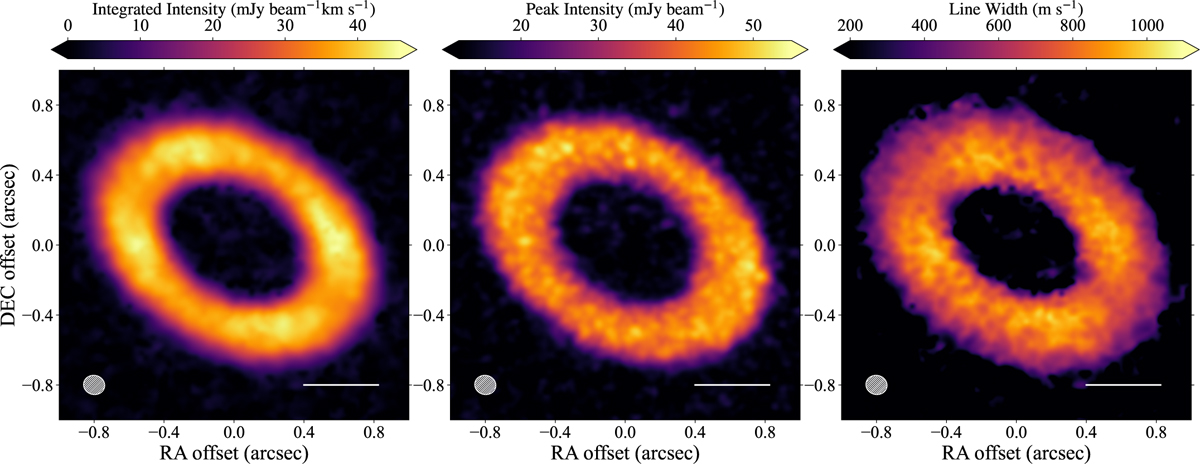
12CO emission for HD 121617. Left: velocity integrated intensity map created by shifting the spectral emission and integrating along the velocity axis for all channels with emission above 4σ. Middle: peak intensity map generated using the quadratic method with bettermoments. Right: linewidth FWHM map produced by dividing the velocity integrated intensity map by the peak intensity map and converting it to FWHM, assuming a Gaussian line profile shape. The beam size is shown in the lower-left corner of each panel. The horizontal white bar indicates 50 au. The corresponding maps for 13CO can be found in Appendix B.
Current usage metrics show cumulative count of Article Views (full-text article views including HTML views, PDF and ePub downloads, according to the available data) and Abstracts Views on Vision4Press platform.
Data correspond to usage on the plateform after 2015. The current usage metrics is available 48-96 hours after online publication and is updated daily on week days.
Initial download of the metrics may take a while.