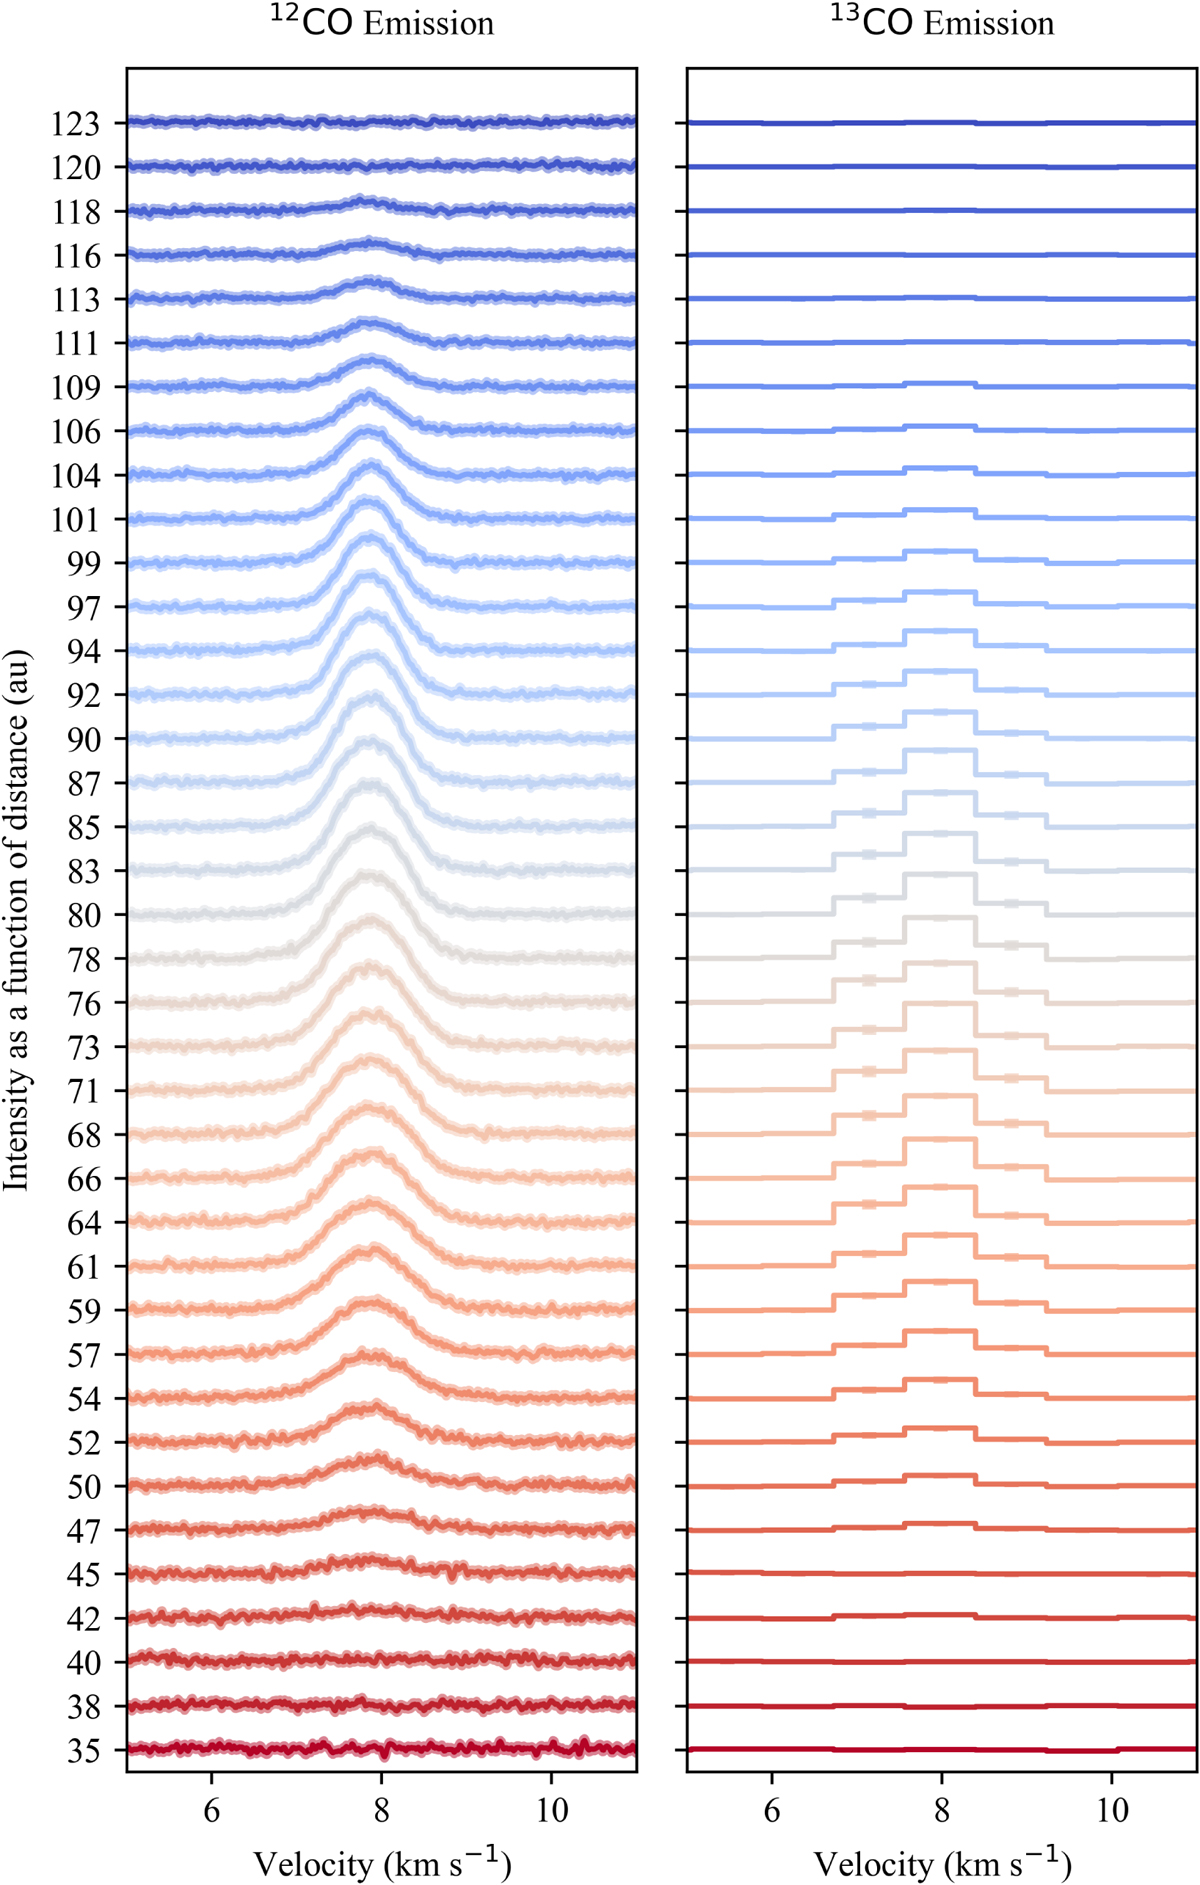
Fig. 3
Download original image
Local line profiles for 12CO (left panel) and 13CO (right panel) as a function of distance from the star. The error bars for 12CO in the left panel (shaded regions) and for 13CO in the right panel (error bars) have been re-scaled by constant factors f12 and f13, respectively, as fitted in Section 4.2. These errors are small and only marginally visible.
Current usage metrics show cumulative count of Article Views (full-text article views including HTML views, PDF and ePub downloads, according to the available data) and Abstracts Views on Vision4Press platform.
Data correspond to usage on the plateform after 2015. The current usage metrics is available 48-96 hours after online publication and is updated daily on week days.
Initial download of the metrics may take a while.