Fig. 4
Download original image
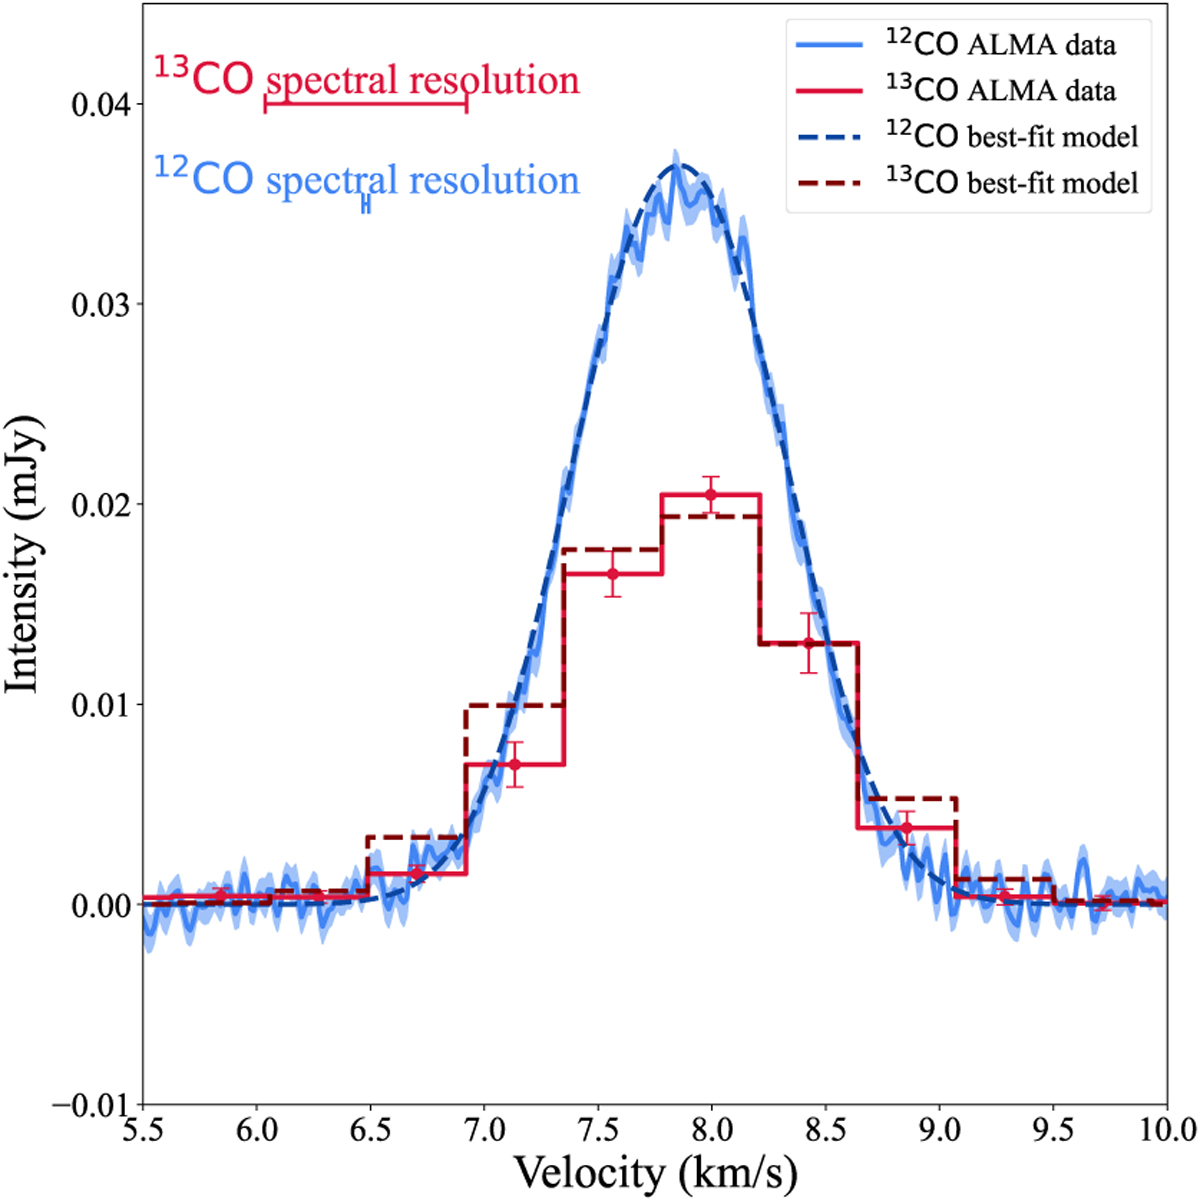
Local line profiles for 12CO (blue) and 13CO (red) created from an annulus extracted at the peak gas surface density (![]() –
–![]() ). Best-fit models (dashed lines) are generated using best-fit values from Table 3. Top left: spectral resolution for 12CO (blue) and 13CO (red). Error bars for 12CO (blue) and 13CO (red) have been re-scaled by the fitted factor f12 and f13.
). Best-fit models (dashed lines) are generated using best-fit values from Table 3. Top left: spectral resolution for 12CO (blue) and 13CO (red). Error bars for 12CO (blue) and 13CO (red) have been re-scaled by the fitted factor f12 and f13.
Current usage metrics show cumulative count of Article Views (full-text article views including HTML views, PDF and ePub downloads, according to the available data) and Abstracts Views on Vision4Press platform.
Data correspond to usage on the plateform after 2015. The current usage metrics is available 48-96 hours after online publication and is updated daily on week days.
Initial download of the metrics may take a while.