Fig. 5
Download original image
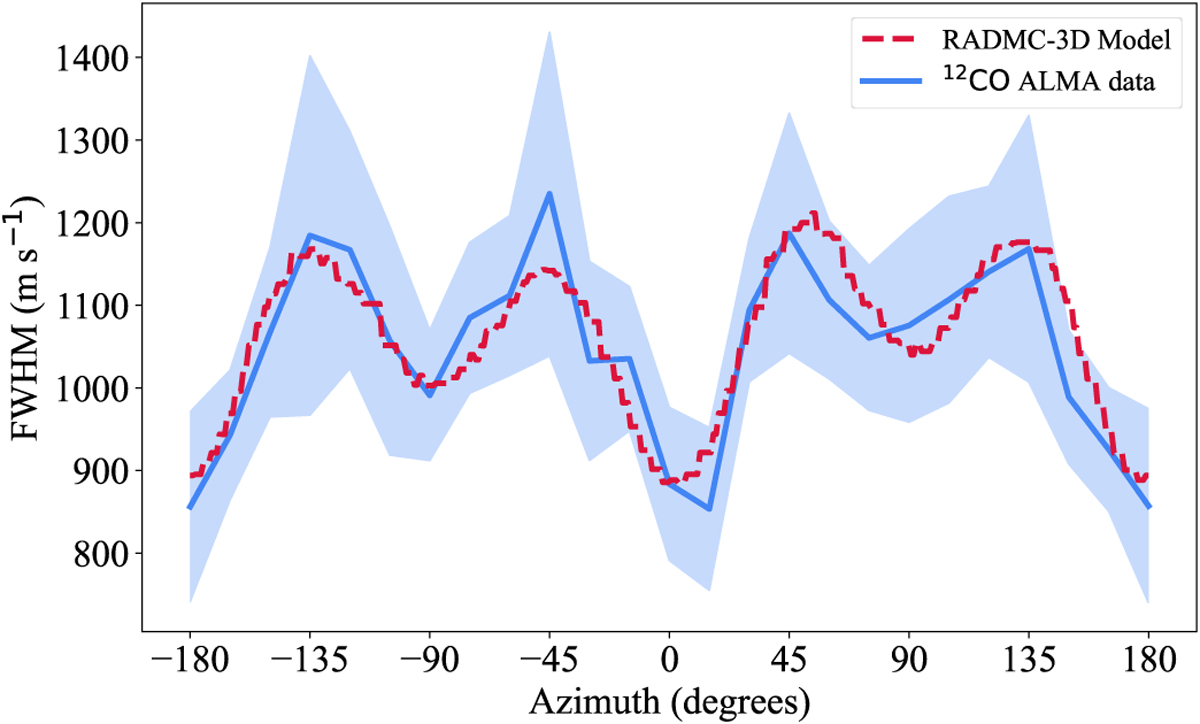
Comparison of FWHM (m s−1) for 12CO ALMA data (blue line) and the RADMC-3D optically thin model (dashed red line), where the FWHM is derived by fitting a Gaussian to each spectrum (assuming azimuthal sections of 15° for the data) using an MCMC approach for both the model and data. For both the model and the data, an annulus between ![]() and
and ![]() (corresponding to the disc’s peak radial surface density) is extracted. The error bars for the 12CO ALMA data (shaded regions) have been re-scaled by a constant factor, which was fitted for.
(corresponding to the disc’s peak radial surface density) is extracted. The error bars for the 12CO ALMA data (shaded regions) have been re-scaled by a constant factor, which was fitted for.
Current usage metrics show cumulative count of Article Views (full-text article views including HTML views, PDF and ePub downloads, according to the available data) and Abstracts Views on Vision4Press platform.
Data correspond to usage on the plateform after 2015. The current usage metrics is available 48-96 hours after online publication and is updated daily on week days.
Initial download of the metrics may take a while.