Fig. C.6
Download original image
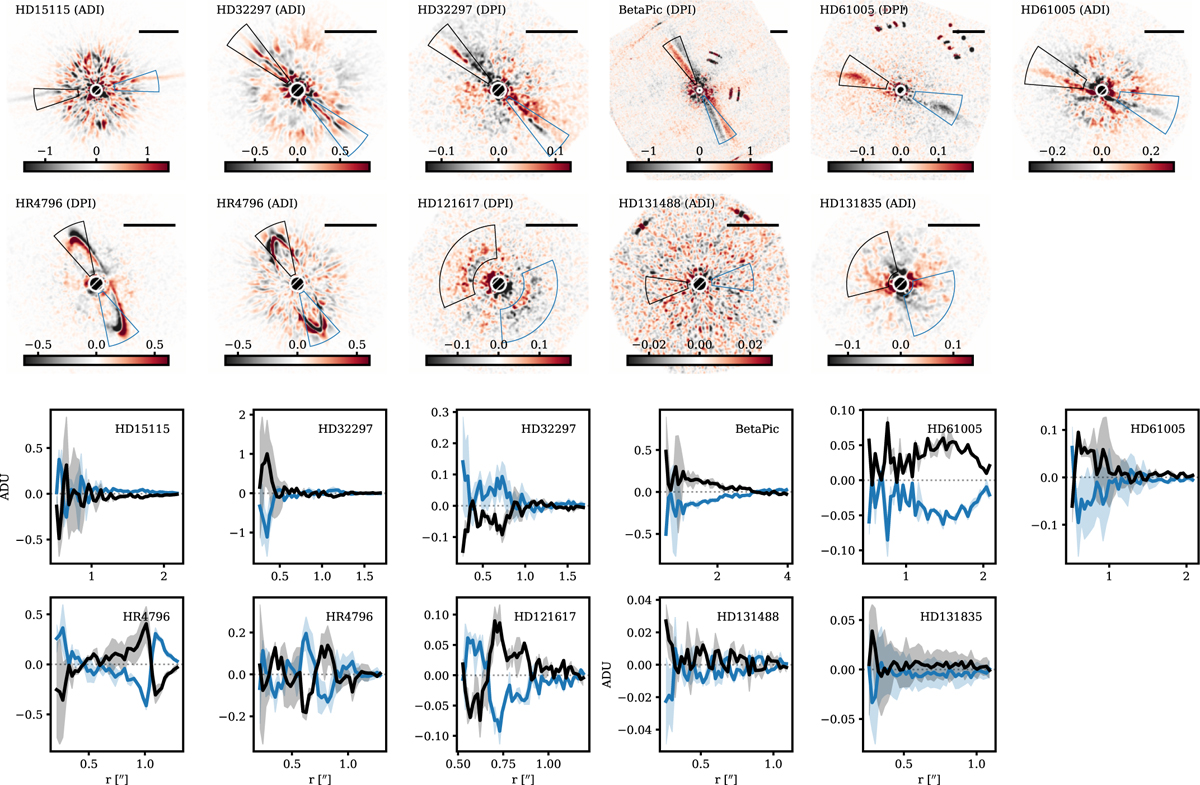
Top: Minor-axis self-subtraction residual maps for systems with SPHERE-detected emission. The black bar in the top right corner of each panel indicates 1″, denoted as either angular differential imaging (ADI) or dual polarisation imaging (DPI), depending on whether the total intensity maps or the Stokes Qϕ component from Milli et al. (2026) are used. Bottom: Radial profiles through the self-subtracted residual maps, estimated inside the wedges shown in the top panel for each corresponding image. The colour-coding of the wedges matches the colour-coding of the radial profiles (black and blue). The profiles present estimated ±1σ uncertainties.
Current usage metrics show cumulative count of Article Views (full-text article views including HTML views, PDF and ePub downloads, according to the available data) and Abstracts Views on Vision4Press platform.
Data correspond to usage on the plateform after 2015. The current usage metrics is available 48-96 hours after online publication and is updated daily on week days.
Initial download of the metrics may take a while.