Fig. 2
Download original image
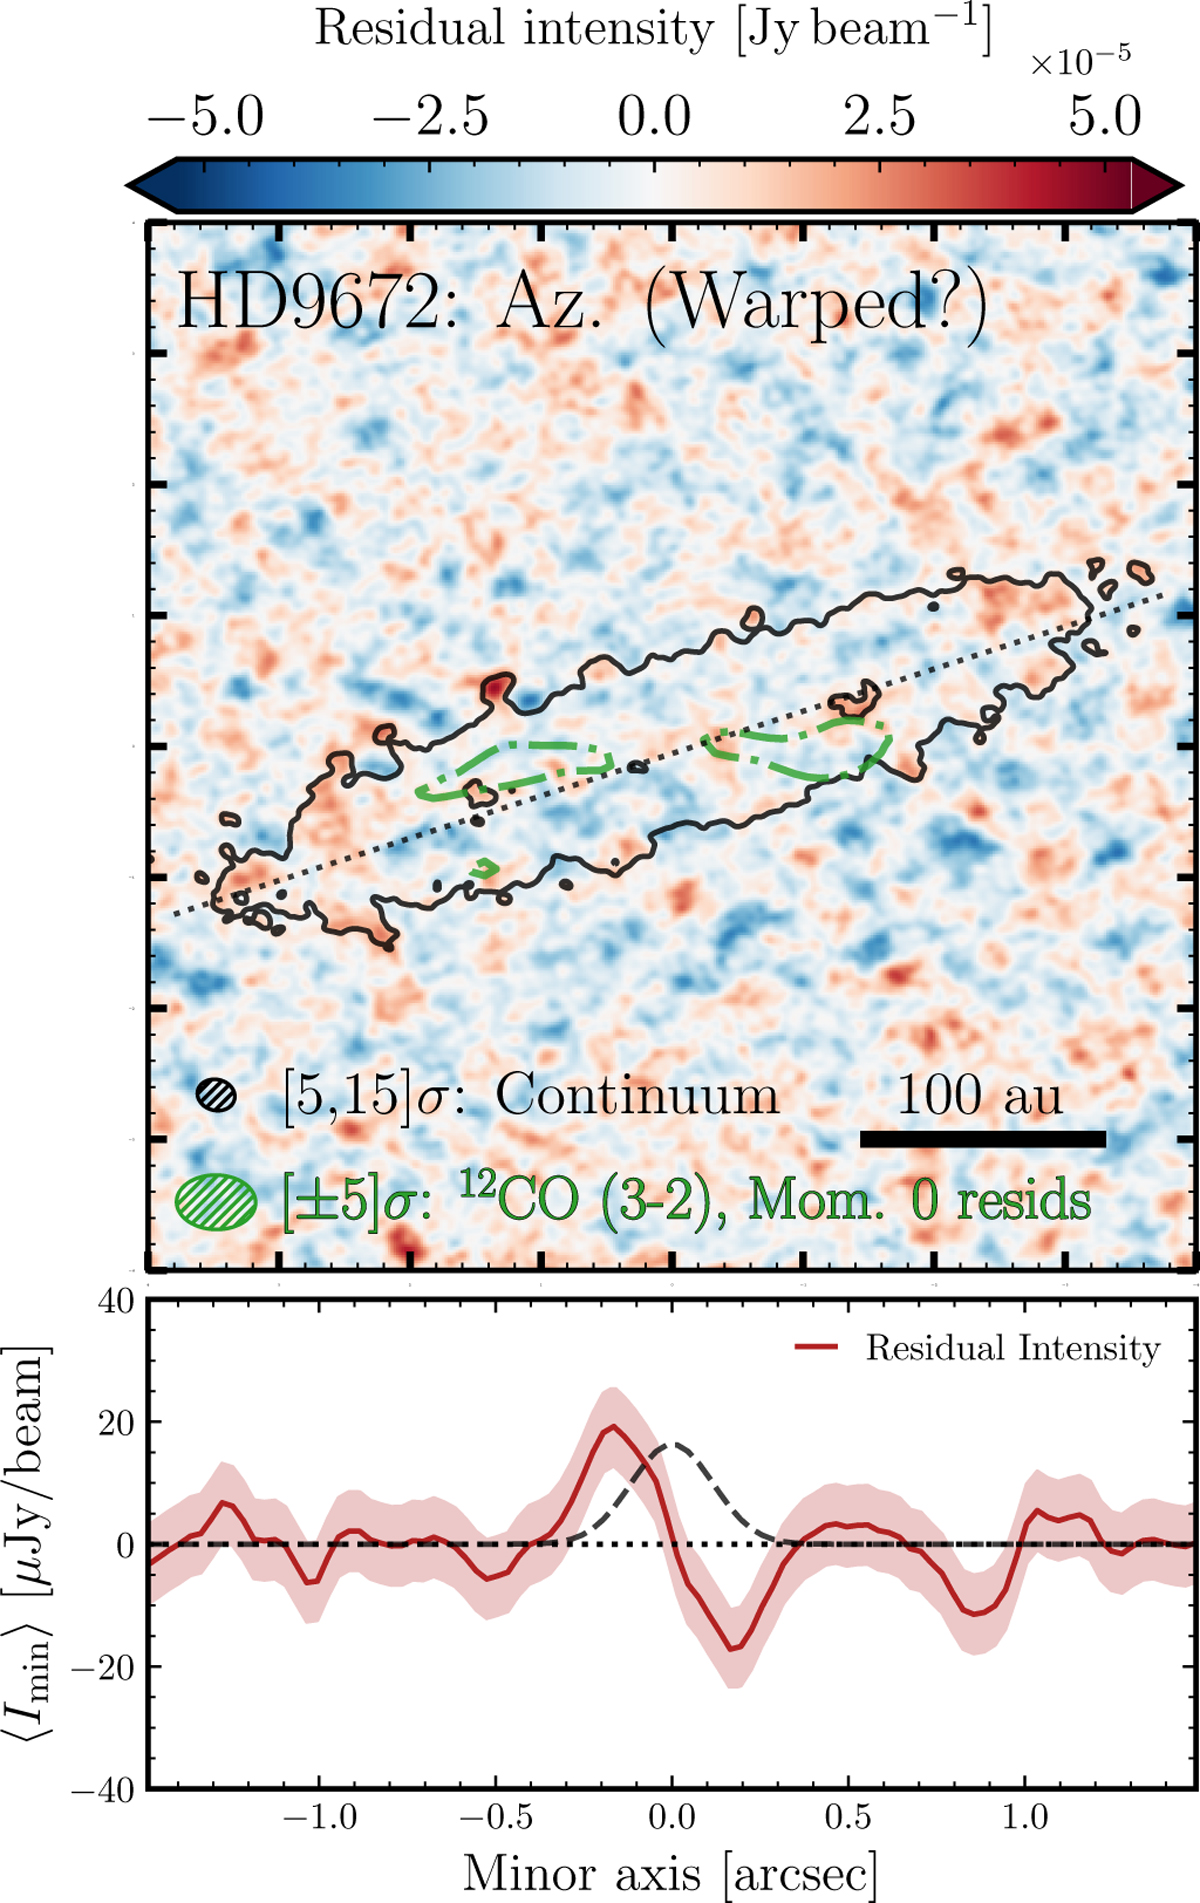
Top: HD 9672 residual map as presented in ARKS III, Zawadzki et al. (2026), with the ARKS continuum image shown in solid black contours, and the 12CO (3–2) moment-zero residuals overplotted as thick dash-dot green contours, as presented in Hughes et al. (2017), cropped to a ±4″ region of the sky. The continuum disc position angle is shown as the black dotted line across the disc. Clean beams, contour scales, and a scale bar are shown on the map. North is up; east is left. Bottom: Minor axis residual intensity profile across a major axis averaged region about the ansae regions, shown in solid red (after reversing the direction of the western ansae). Errors are shown at the ±1σ level, scaled to account for the mean and difference profiles.
Current usage metrics show cumulative count of Article Views (full-text article views including HTML views, PDF and ePub downloads, according to the available data) and Abstracts Views on Vision4Press platform.
Data correspond to usage on the plateform after 2015. The current usage metrics is available 48-96 hours after online publication and is updated daily on week days.
Initial download of the metrics may take a while.