Fig. 3
Download original image
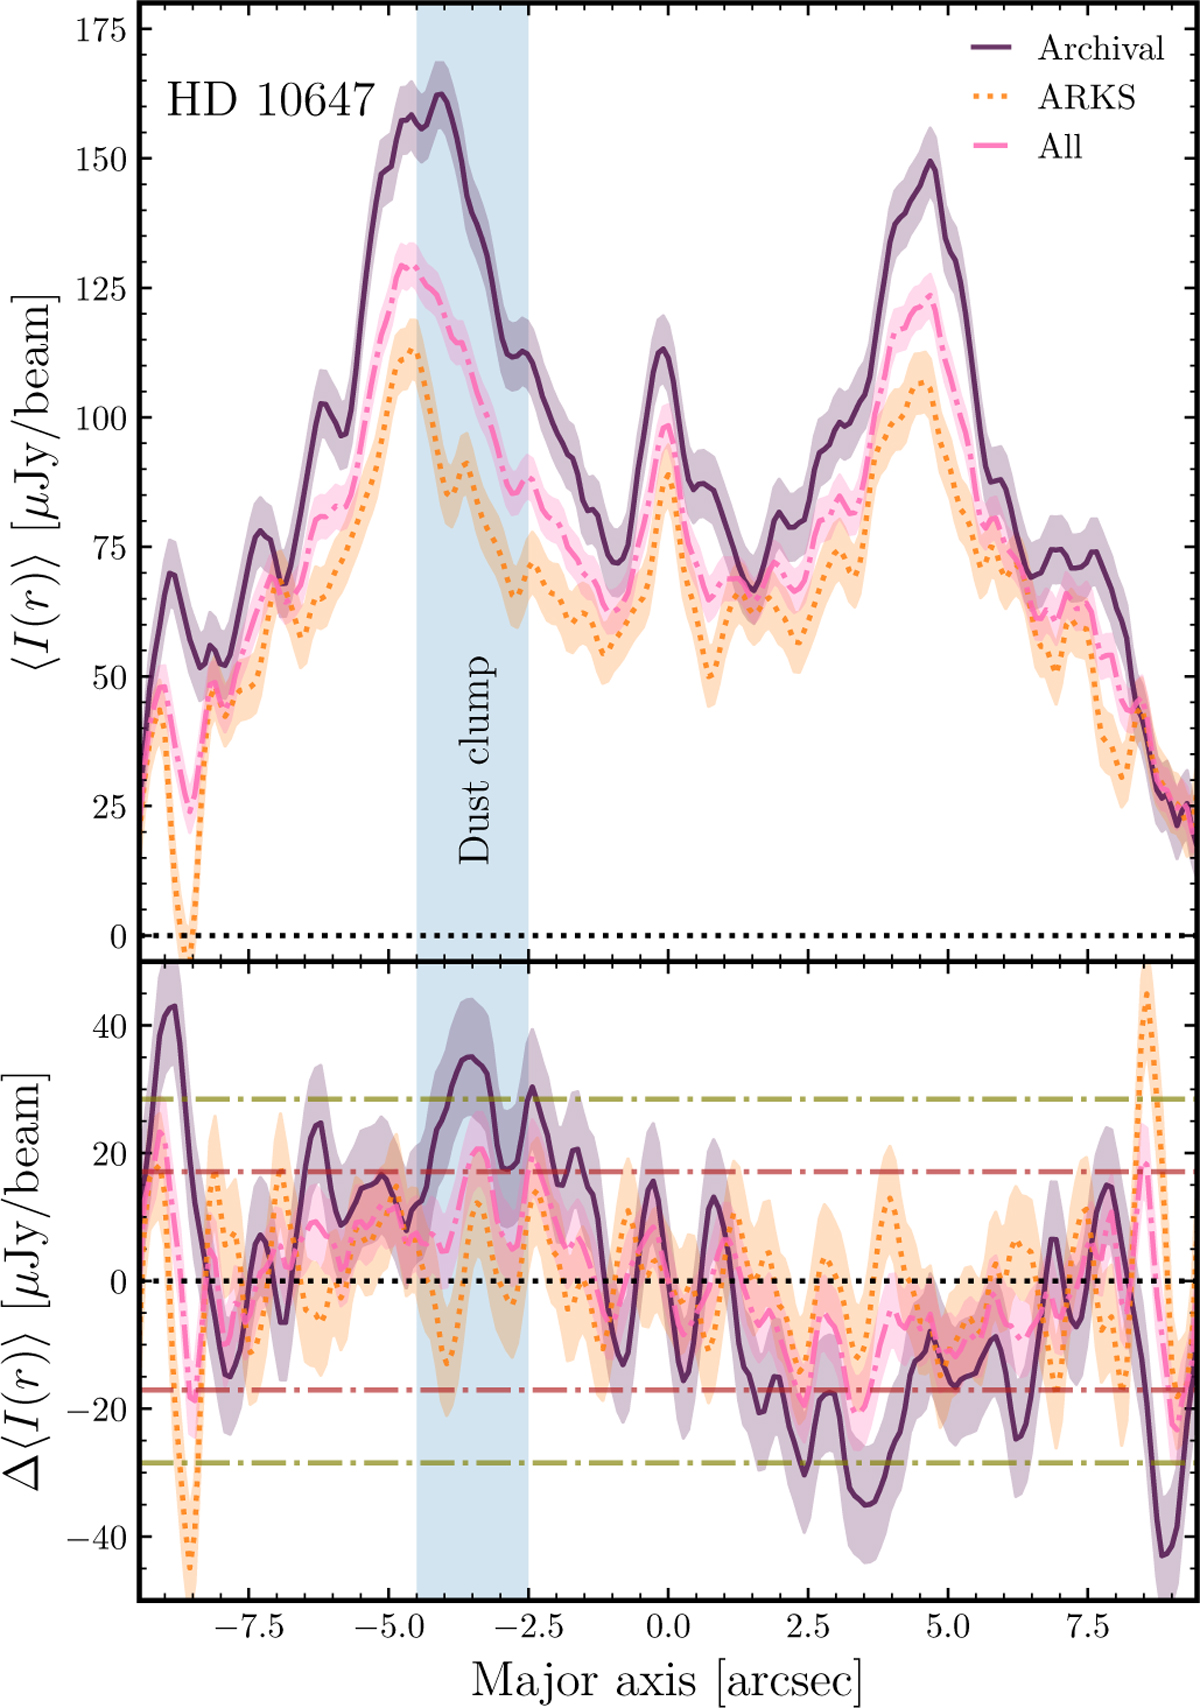
HD 10647 major axis profiles (top) for each of the archival-only, ARKS-only, or combined (‘All’) baselines, and their associated difference profiles (bottom) obtained by self-subtracting the profiles about 0.0″. The major axis direction is negative towards the south-east of the disc. The red and green dash-dot lines represent the ±3σ and ±5σ profile differences for the combined data; the shading gives the error associated with each of the difference profiles, scaled by ![]() to account for the self-subtraction. We also show the ≈40–80 au radial location (wq1 Eri’s dust clump from Lovell et al. (2021a).
to account for the self-subtraction. We also show the ≈40–80 au radial location (wq1 Eri’s dust clump from Lovell et al. (2021a).
Current usage metrics show cumulative count of Article Views (full-text article views including HTML views, PDF and ePub downloads, according to the available data) and Abstracts Views on Vision4Press platform.
Data correspond to usage on the plateform after 2015. The current usage metrics is available 48-96 hours after online publication and is updated daily on week days.
Initial download of the metrics may take a while.