Fig. 4
Download original image
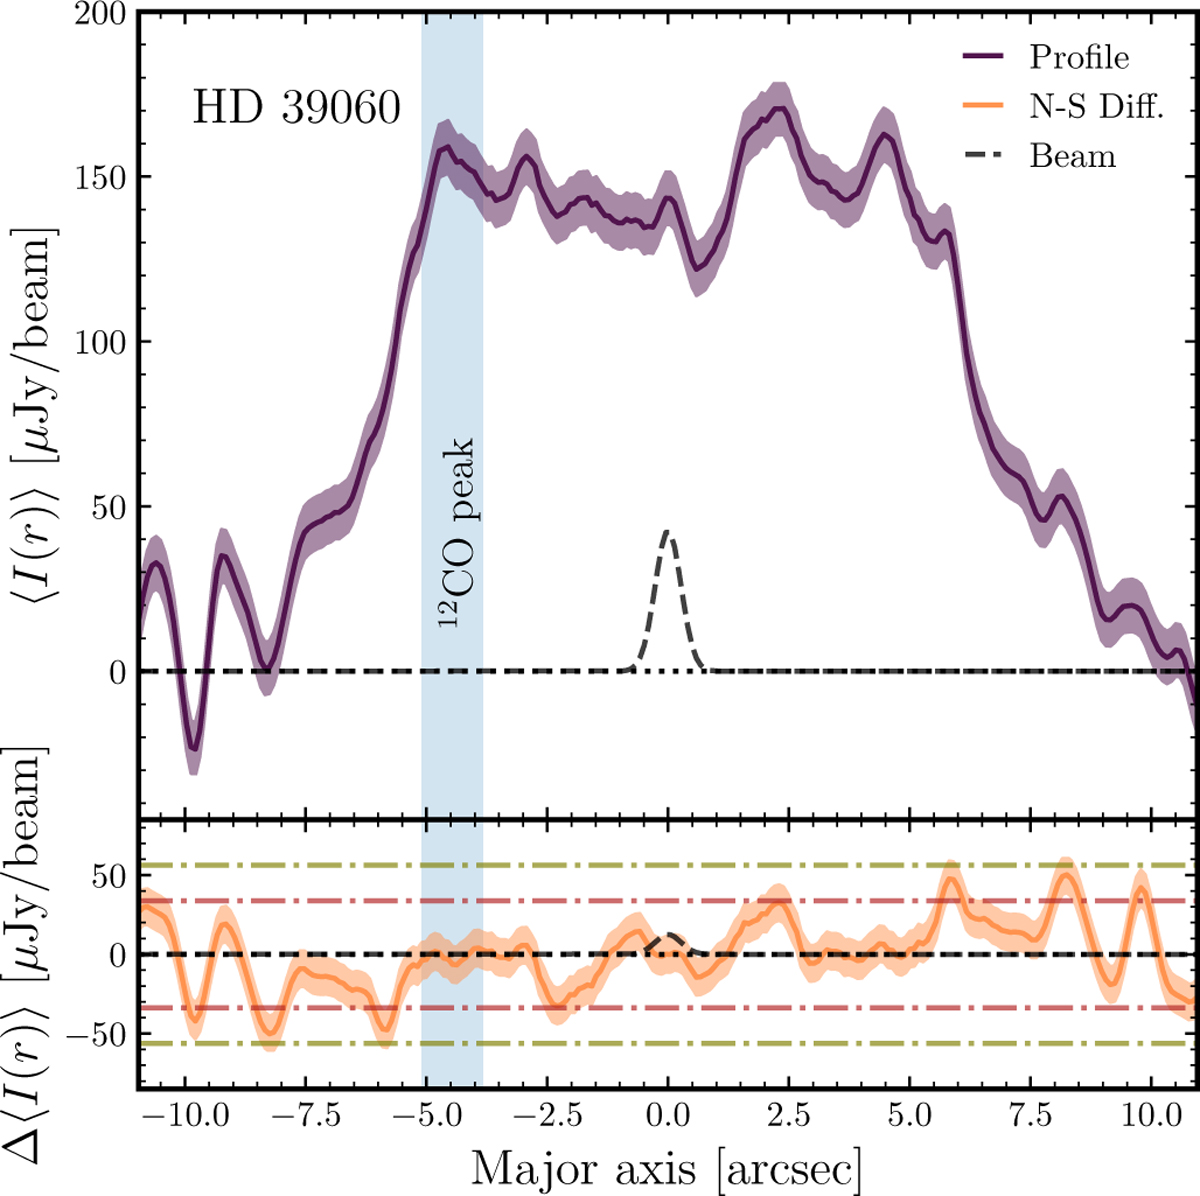
HD 39060 (β Pic) major axis profile (top) from the south (minus major axis direction) to the north (positive radial direction), and its associated major axis difference profile about the image centre (bottom). We show in red and green dash-dot lines ±3σ and ±5σ profile differences, and in amber the error associated with the difference profile, scaled by ![]() to account for the uncertainty in the self-subtraction of the profile. We also show the ≈85 au radial location (in blue) associated with β Pic’s known CO clump from Dent et al. (2014).
to account for the uncertainty in the self-subtraction of the profile. We also show the ≈85 au radial location (in blue) associated with β Pic’s known CO clump from Dent et al. (2014).
Current usage metrics show cumulative count of Article Views (full-text article views including HTML views, PDF and ePub downloads, according to the available data) and Abstracts Views on Vision4Press platform.
Data correspond to usage on the plateform after 2015. The current usage metrics is available 48-96 hours after online publication and is updated daily on week days.
Initial download of the metrics may take a while.