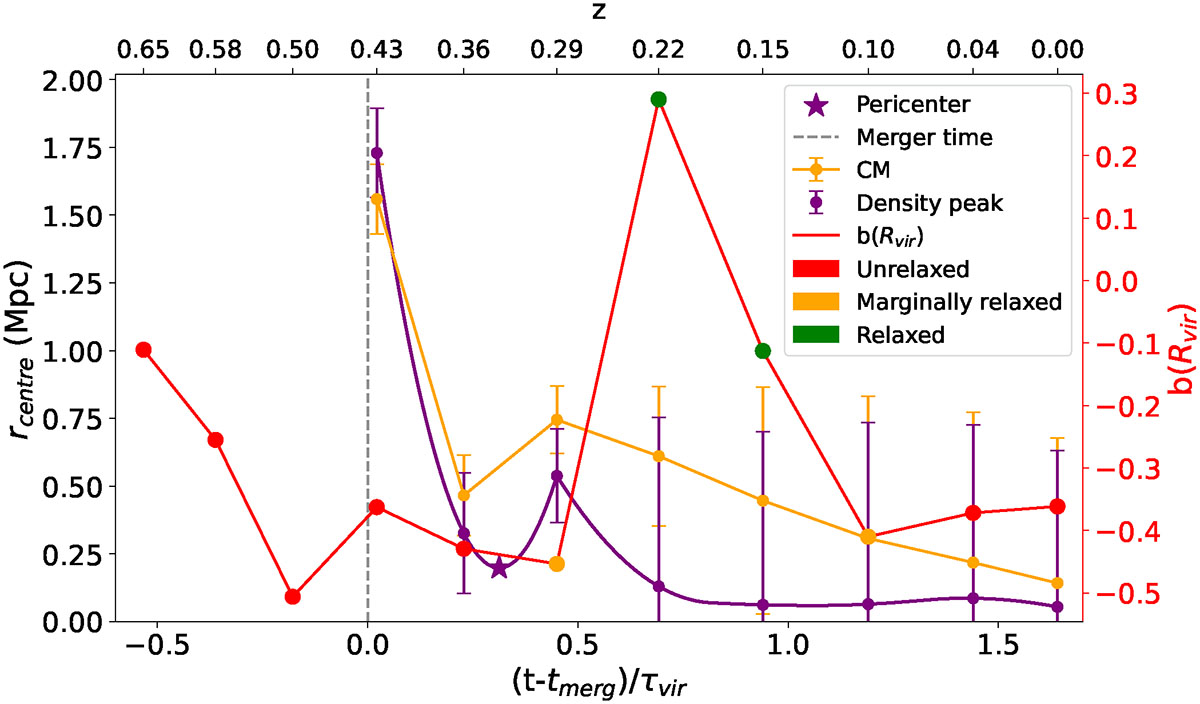
Fig. 10.
Download original image
Evolution of the mass bias and the distance between the centres of the host and infalling halos during the major merger. The red curve shows the hydrostatic mass bias (red line and right axis) evolution during the major merger event for the galaxy cluster CL1. The colour of the markers over the bias curve indicates the dynamical state according to the colour code detailed in the legend. The connected dots with error bars show the radial distance (orange line) between the CM and the density peak (purple line) of the merging halo with respect to the host (left axis). The star-shaped scatter point is the parabolic interpolation of the pericentre for the infalling orbit.
Current usage metrics show cumulative count of Article Views (full-text article views including HTML views, PDF and ePub downloads, according to the available data) and Abstracts Views on Vision4Press platform.
Data correspond to usage on the plateform after 2015. The current usage metrics is available 48-96 hours after online publication and is updated daily on week days.
Initial download of the metrics may take a while.