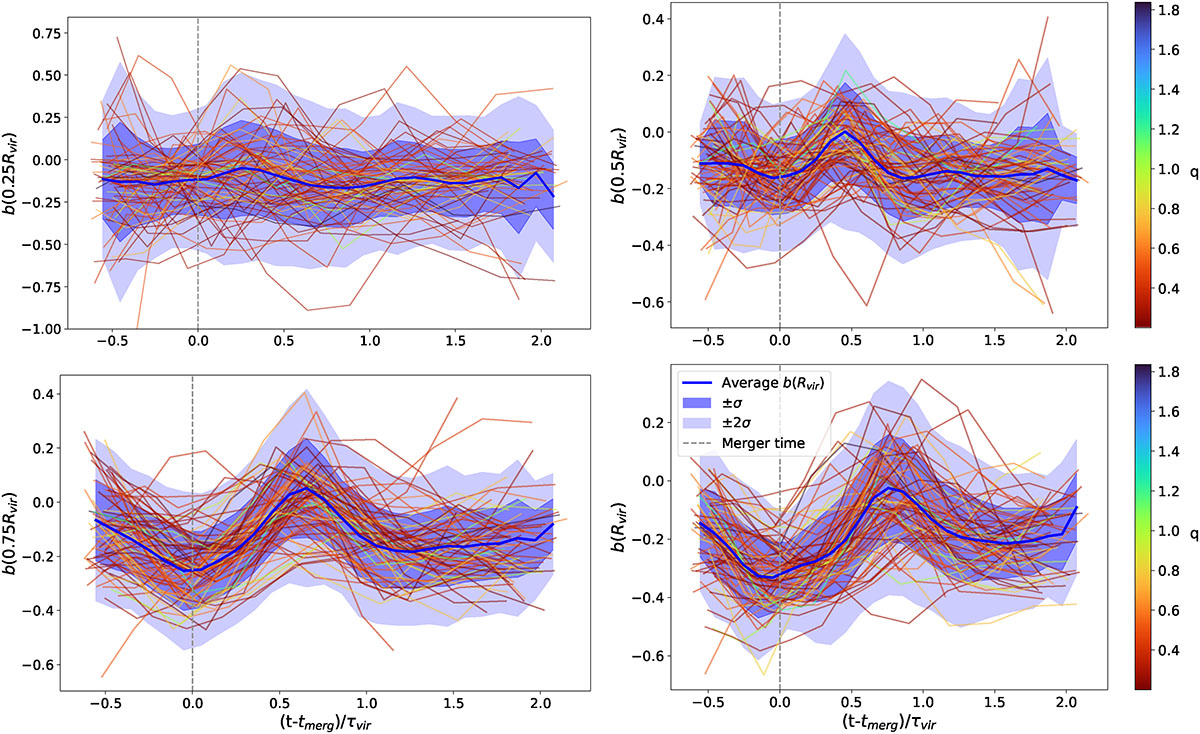
Fig. 5.
Download original image
Standardised evolution of the hydrostatic mass bias, evaluated at several radii, 0.25Rvir, 0.5Rvir, 0.75Rvir and Rvir, for the sample of isolated major merger events. The time coordinate has been normalised to the virial timescale at the corresponding epoch as (t − tmerg)/τvir and is vertically aligned with respect to the panels to facilitate comparison. The colour bar illustrates the magnitude of the merger mass ratio, q, and the average mass bias trend is depicted in blue with the corresponding 1σ and 2σ shadowed areas.
Current usage metrics show cumulative count of Article Views (full-text article views including HTML views, PDF and ePub downloads, according to the available data) and Abstracts Views on Vision4Press platform.
Data correspond to usage on the plateform after 2015. The current usage metrics is available 48-96 hours after online publication and is updated daily on week days.
Initial download of the metrics may take a while.