Open Access
Fig. 6.
Download original image
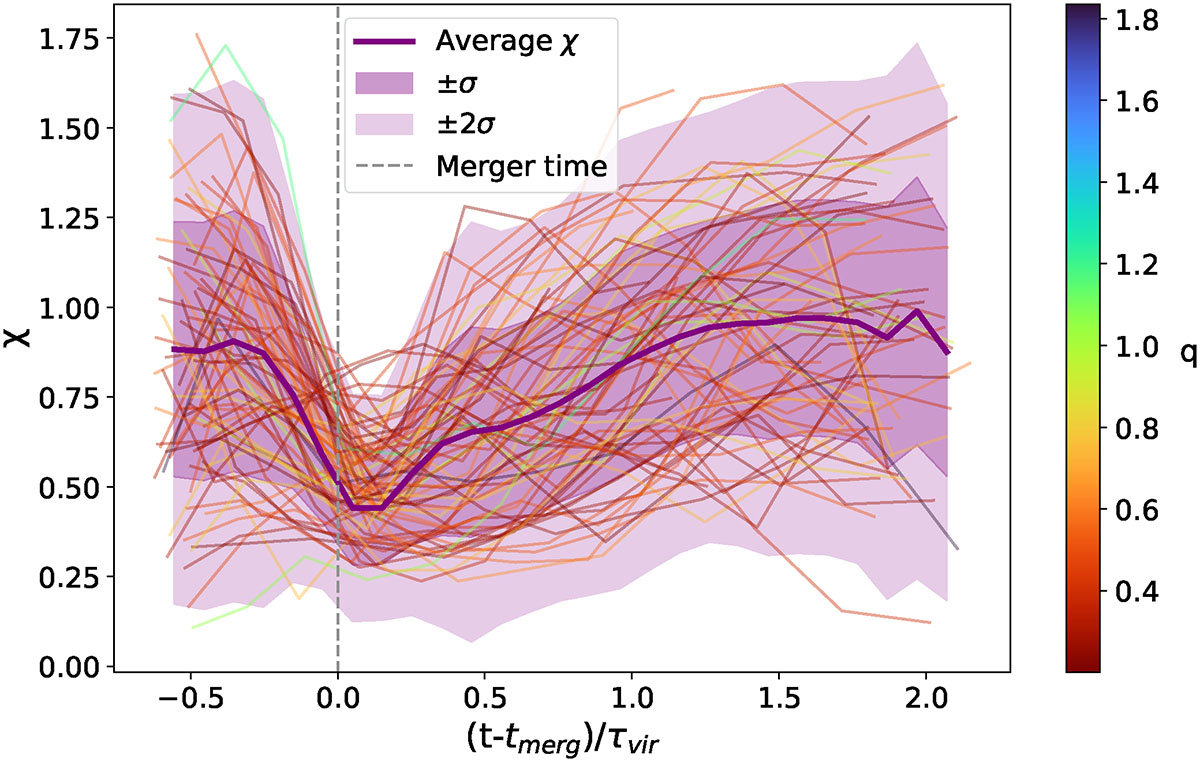
Evolution of the dynamical state indicator during the major merger event for the selected events. The Colour bar shows the merger mass ratio, q, the time coordinate is normalised to the virial time, τvir, and the average χ trend is depicted in purple with the corresponding 1σ and 2σ shadowed areas.
Current usage metrics show cumulative count of Article Views (full-text article views including HTML views, PDF and ePub downloads, according to the available data) and Abstracts Views on Vision4Press platform.
Data correspond to usage on the plateform after 2015. The current usage metrics is available 48-96 hours after online publication and is updated daily on week days.
Initial download of the metrics may take a while.