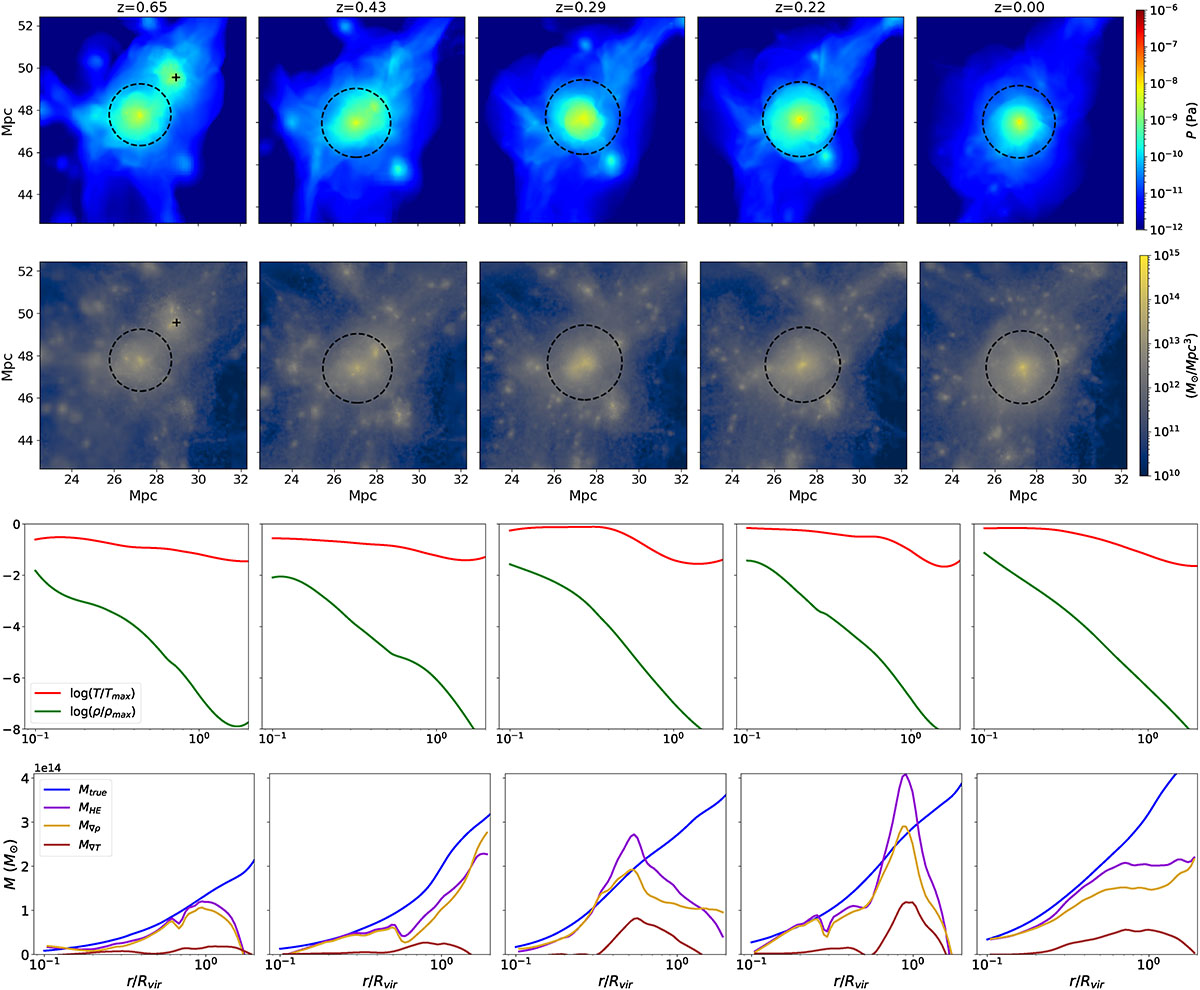
Fig. 9.
Download original image
Temporal evolution of a merging event between two galaxy clusters with a mass ratio of 1:2. Top panels: Variation of the projected pressure map during the event. Second row panels: Evolution of the projected total density. In these panels, within the 2D projected maps the virial radius of the host halo is marked with a dashed circle, whereas the centre of the infalling halo, while being outside of the host, is given by a black cross. Third row panels: Evolution of the logarithmic temperature (red) and density (green). The thermodynamic variables have been normalised to the maximum of their evolution to allow for visual comparison. Bottom panels: Evolution of the true mass radial profile (blue), the hydrostatic mass profile estimate (purple) and, according to Eq. (3), the individual contributions to the hydrostatic mass profile from density (yellow) and temperature gradients (brown).
Current usage metrics show cumulative count of Article Views (full-text article views including HTML views, PDF and ePub downloads, according to the available data) and Abstracts Views on Vision4Press platform.
Data correspond to usage on the plateform after 2015. The current usage metrics is available 48-96 hours after online publication and is updated daily on week days.
Initial download of the metrics may take a while.