Fig. 1
Download original image
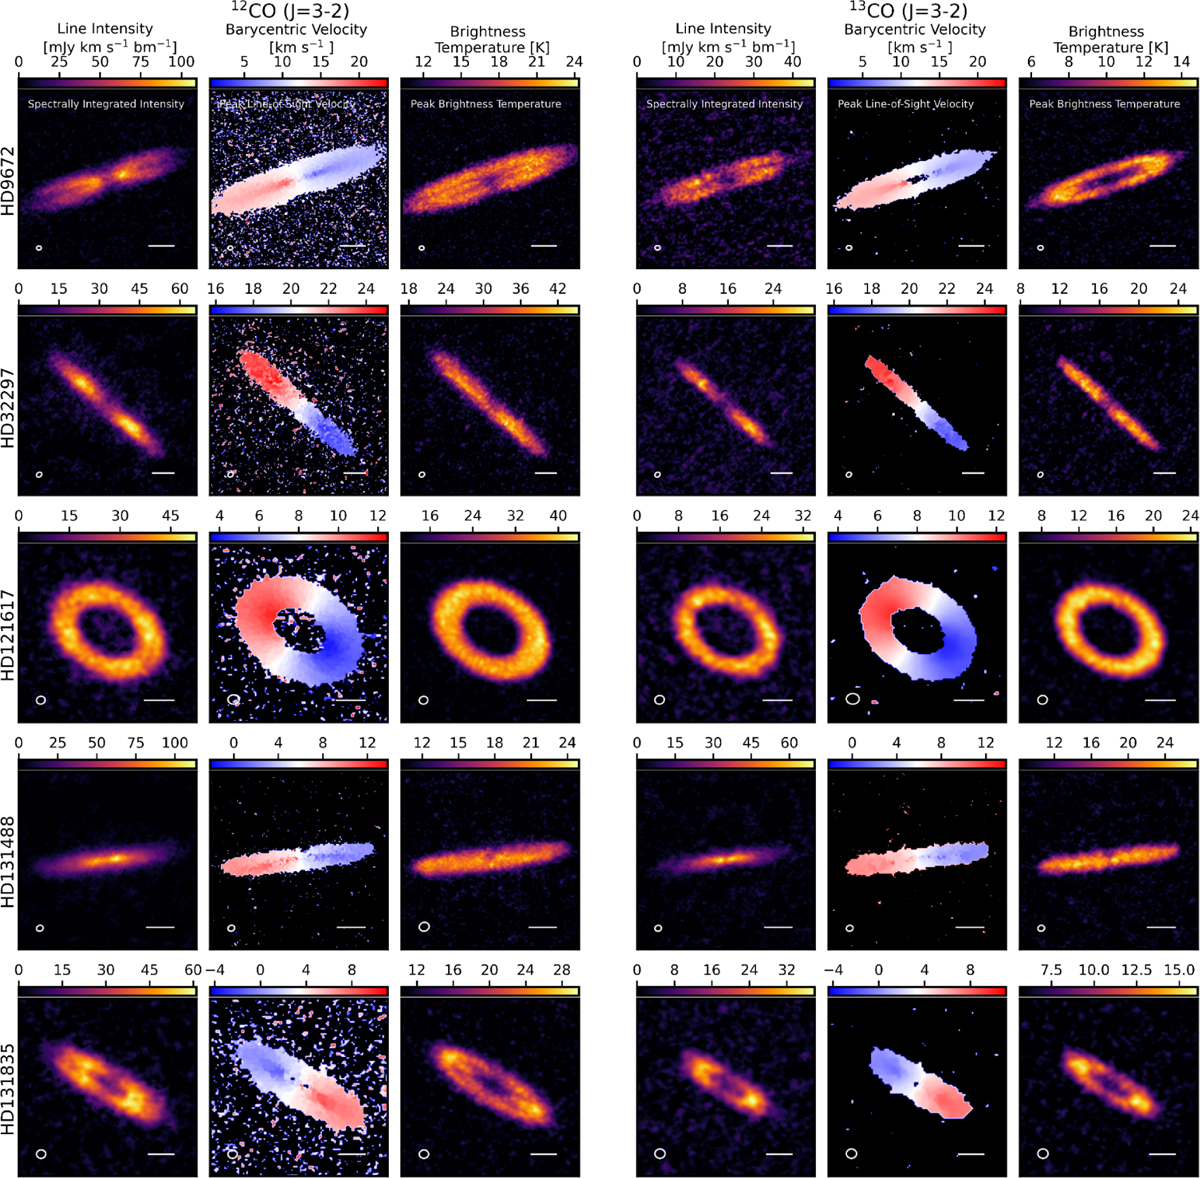
12CO (left) and 13CO (right) emission of the five gas-bearing disks in ARKS, HD 9672, HD 32297, HD 121617, HD 131488, and HD 131835 (from top to bottom). The first and fourth column in each row shows the spectrally integrated-intensity map of each disc for 12CO and 13CO, respectively. The minimum line intensity of these integrated-intensity maps was set at 0 mJy km s−1 beam−1. The second and fifth columns shows the peak velocity map of each disc for 12CO and 13CO, respectively. Each is centred on the stellar velocity of the systems, and any pixel outside of the velocity range shown in the colour bar is set to black. The peak-intensity (brightness temperature) map of each disc is shown in the third and sixth column for 12CO and 13CO, respectively. The minimum brightness temperature shown in the colour bar is the mean of the emission far from the discs. The ellipse in the lower left corners of the maps is the synthesized beam of the observations. The white scale bar in the bottom right corners indicates 50 au.
Current usage metrics show cumulative count of Article Views (full-text article views including HTML views, PDF and ePub downloads, according to the available data) and Abstracts Views on Vision4Press platform.
Data correspond to usage on the plateform after 2015. The current usage metrics is available 48-96 hours after online publication and is updated daily on week days.
Initial download of the metrics may take a while.