Fig. 2
Download original image
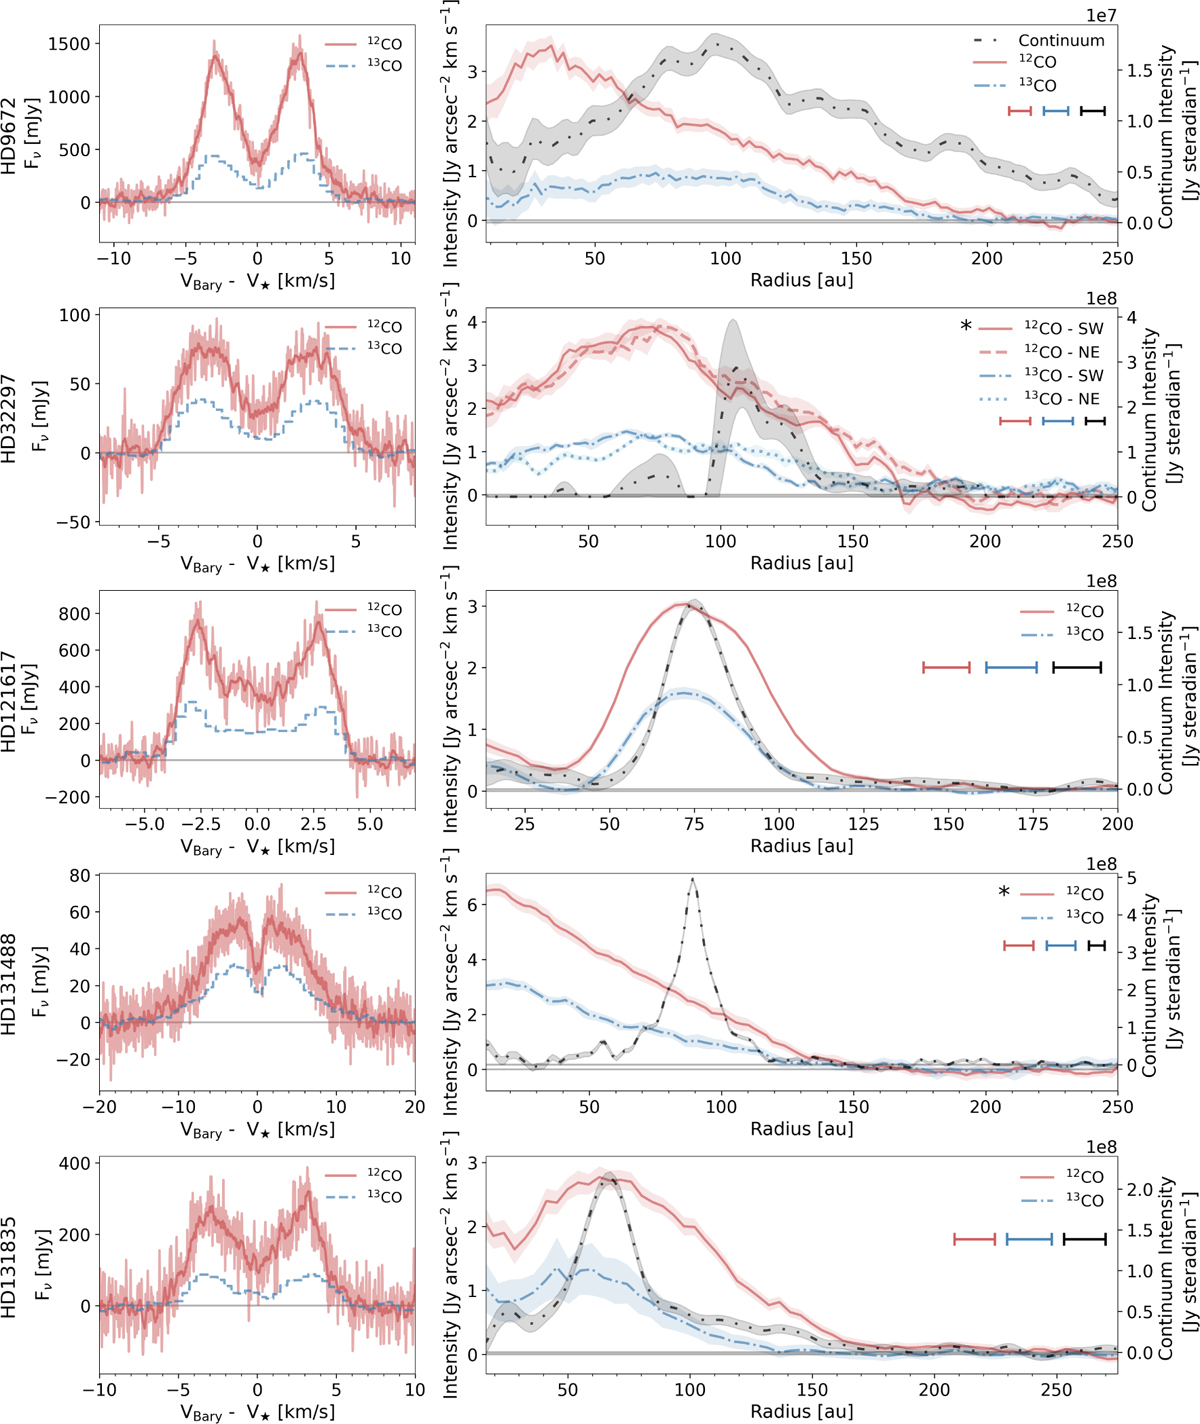
Left column: spatially integrated spectrum of the 12CO(3-2) (red) and 13CO(3-2) (blue) emission from HD 9672, HD 32297, HD 121617, HD 131488, and HD 131835 in the barycentric velocity frame. The 12CO spectra are additionally shown smoothed with a running mean (window size = 20), chosen to remove noise variation while preserving spectral features. Right column: radial profiles for the same discs. Radial profiles for HD 9672, HD 121617 and HD 131488 were created by azimuthally integrating the emission in each disc. The radial profiles for HD 32297 and HD 131488 (marked by *) are surface brightness profiles as a function of projected separation from the star along the major axis (rather than as a function of radius). For HD 32297, the radial distribution varies for each side of the discs so both sides are shown, in both 12CO and 13CO. For HD 131488, there is no significant differences between both sides of the disc, so an average radial profile is shown. The black radial profiles show the CLEAN dust profiles (Han et al. 2026). In each panel, the minimum value of R corresponds to the first resolution element of the observations. The red, blue and black horizontal bars indicate the resolution of the observations.
Current usage metrics show cumulative count of Article Views (full-text article views including HTML views, PDF and ePub downloads, according to the available data) and Abstracts Views on Vision4Press platform.
Data correspond to usage on the plateform after 2015. The current usage metrics is available 48-96 hours after online publication and is updated daily on week days.
Initial download of the metrics may take a while.