Fig. D.1
Download original image
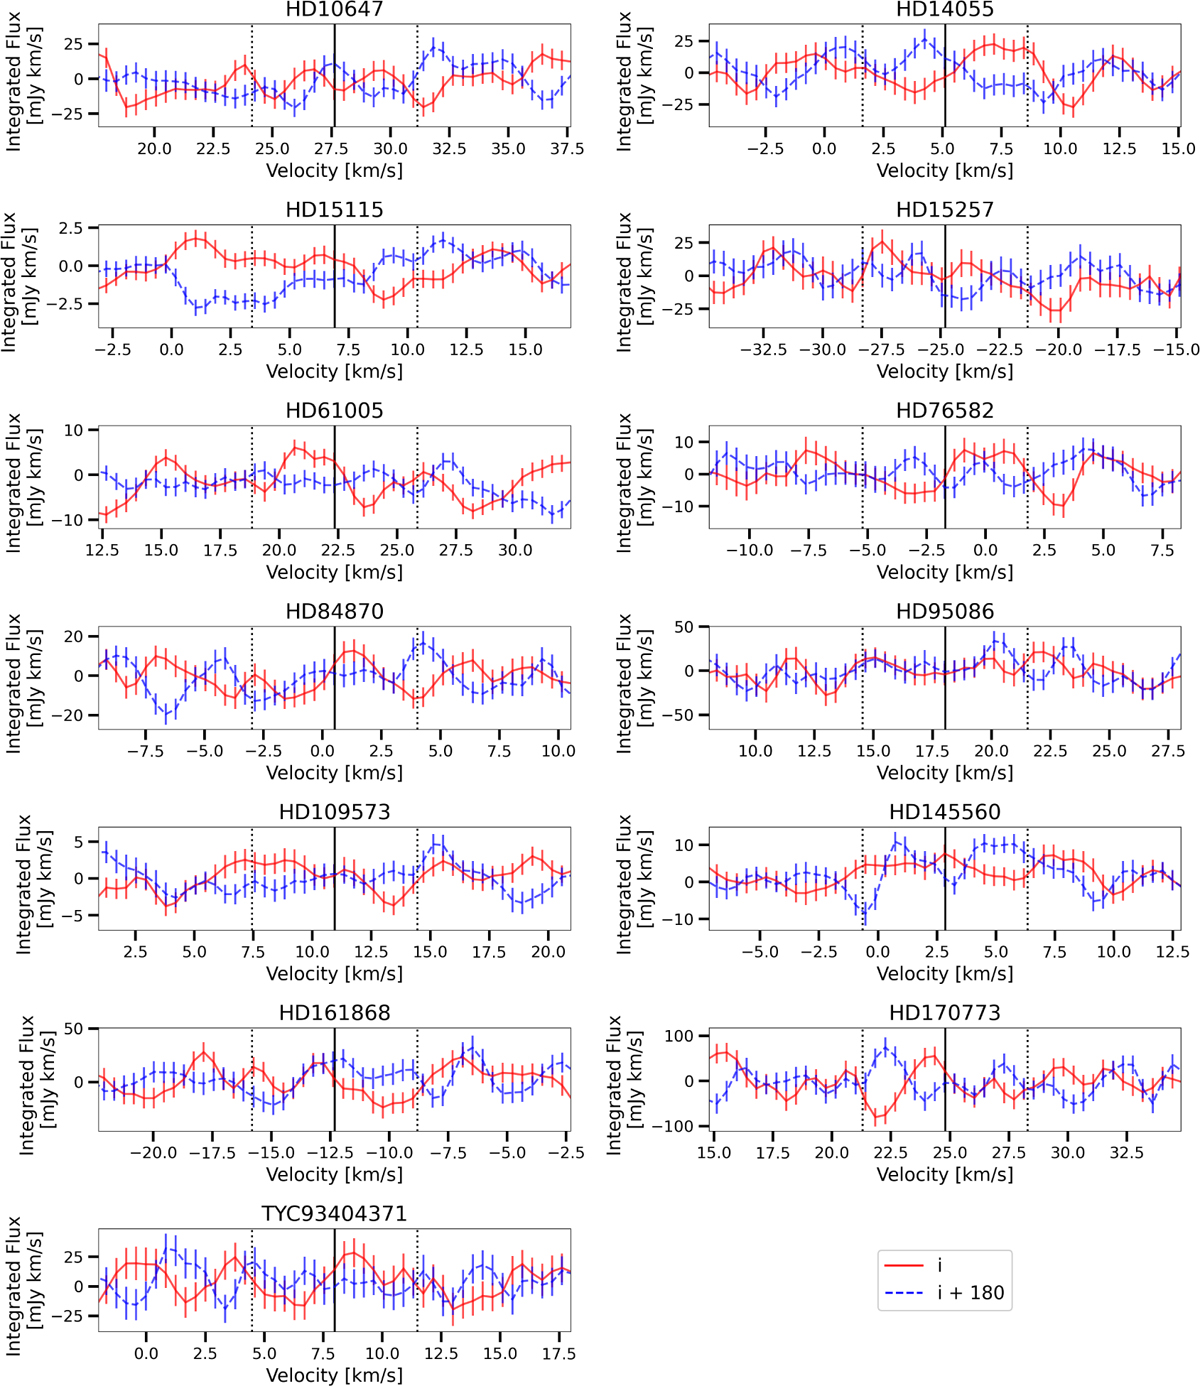
The spectro-spatially stacked spectra of the ARKS targets where no CO emission was detected. In each plot, we show both the spectrum shifted with the disc’s inclination i and also with i + 180°, to eliminate the degeneracy between rotational direction and inclination. The black solid line indicates the stellar velocity, in the barycentric frame, which is where we would expect to see a peak if gas was detected in the system. The black dotted lines indicate the region of V⋆ ± 3.5 km s−1 which was integrated over to calculate the line flux.
Current usage metrics show cumulative count of Article Views (full-text article views including HTML views, PDF and ePub downloads, according to the available data) and Abstracts Views on Vision4Press platform.
Data correspond to usage on the plateform after 2015. The current usage metrics is available 48-96 hours after online publication and is updated daily on week days.
Initial download of the metrics may take a while.