Open Access
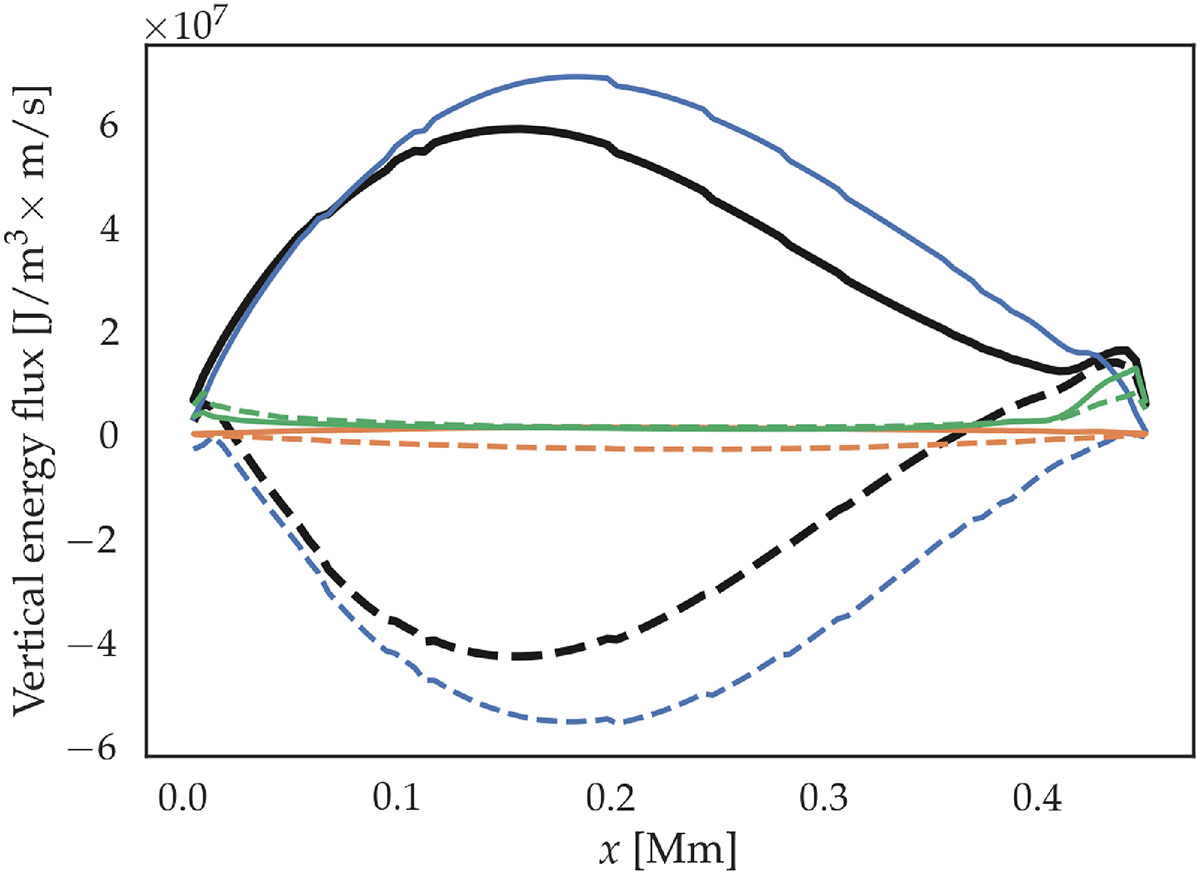
Fig. 10.
Download original image
Breakdown of the energy flux budget into upflow (solid lines) and downflow (dashed lines) energy fluxes. The blue, green, orange and black lines respectively show the convective flux F(e), the radiative flux F(rad), the kinetic energy flux F(kin) and the total energy flux F(tot), as defined by Eq. (28).
Current usage metrics show cumulative count of Article Views (full-text article views including HTML views, PDF and ePub downloads, according to the available data) and Abstracts Views on Vision4Press platform.
Data correspond to usage on the plateform after 2015. The current usage metrics is available 48-96 hours after online publication and is updated daily on week days.
Initial download of the metrics may take a while.