Fig. 11.
Download original image
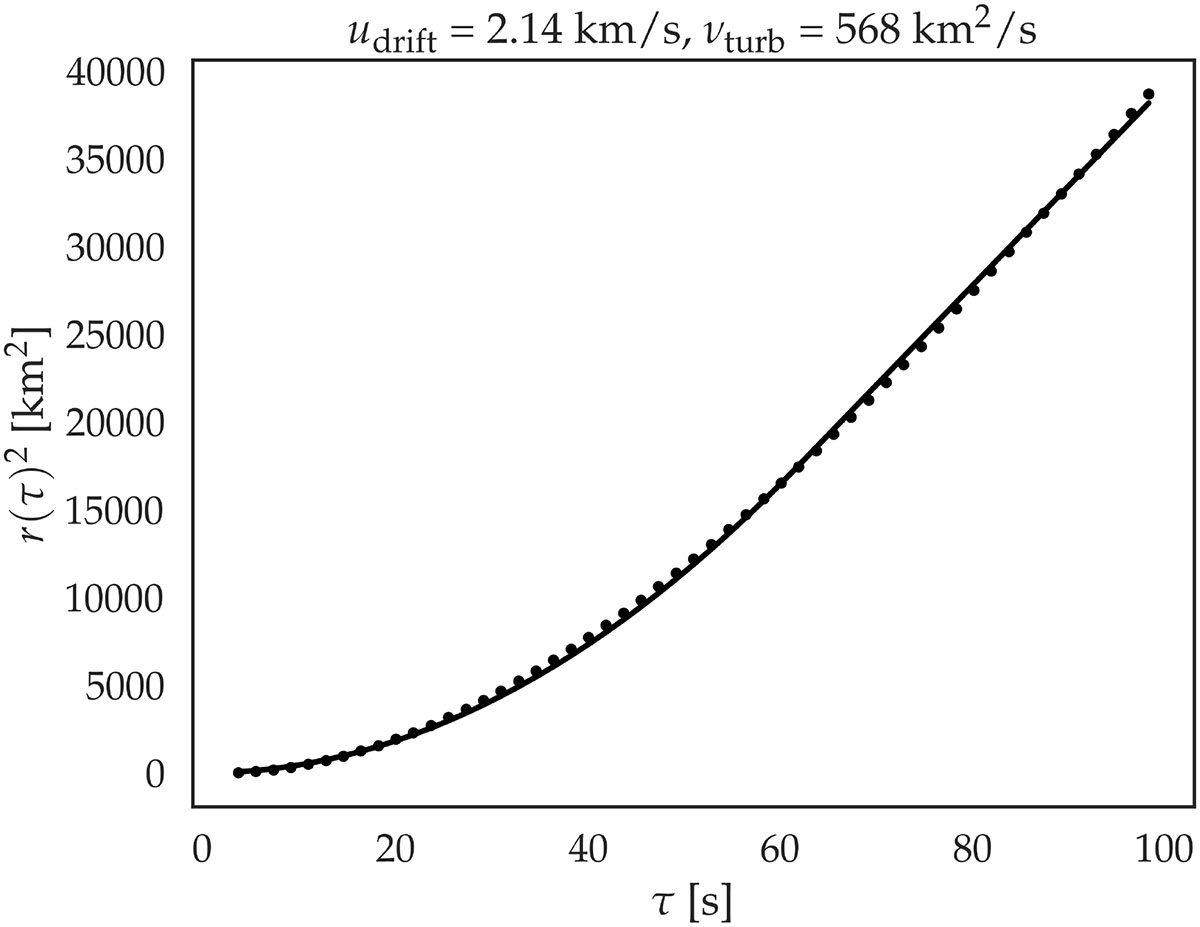
Squared particle dispersion distance r2 as a function of time increment τ, averaged over all particles trajectories. The black dots show the simulation data, and the solid black line shows a fit to the data, using the model described in the text. The RMS particle velocity udrift and turbulent diffusion coefficient νturb estimated from the fit are indicated at the top.
Current usage metrics show cumulative count of Article Views (full-text article views including HTML views, PDF and ePub downloads, according to the available data) and Abstracts Views on Vision4Press platform.
Data correspond to usage on the plateform after 2015. The current usage metrics is available 48-96 hours after online publication and is updated daily on week days.
Initial download of the metrics may take a while.