Open Access
Fig. 3.
Download original image
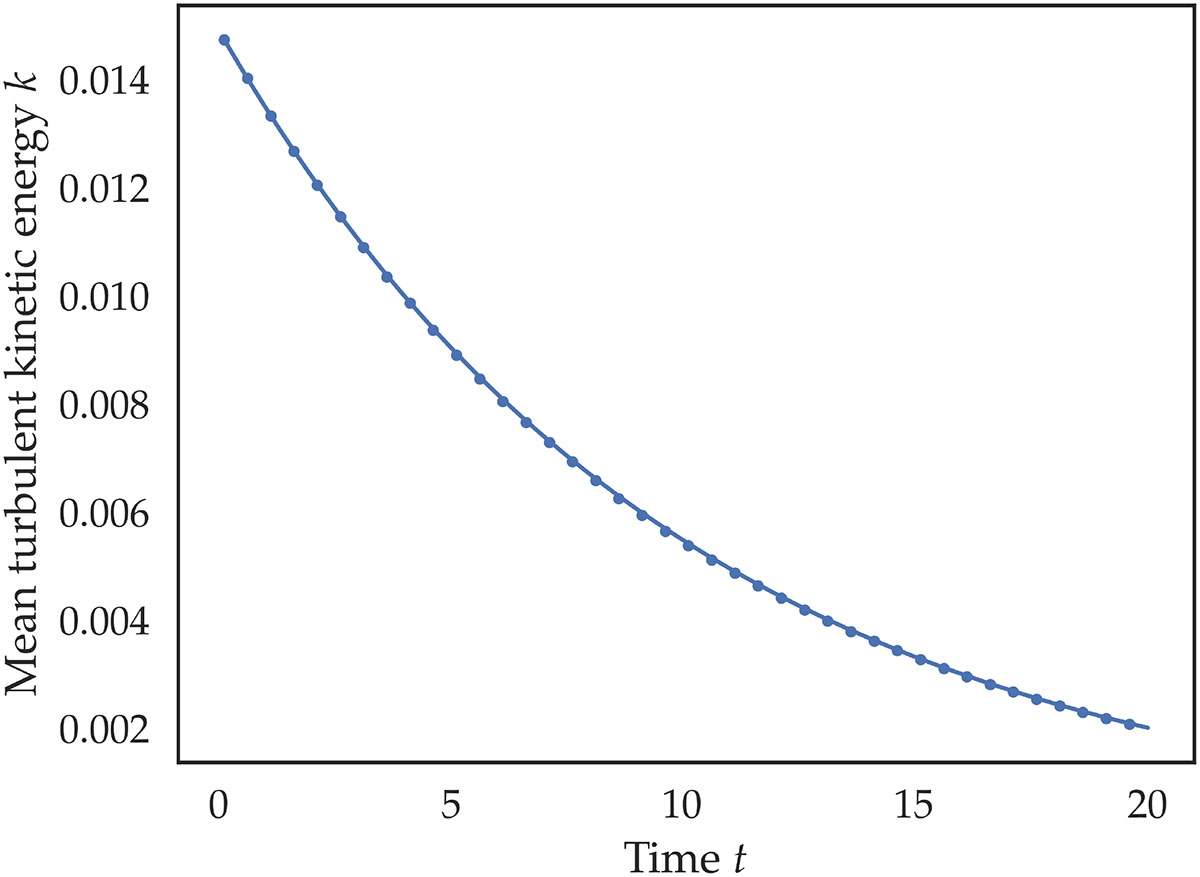
Evolution of the spatially averaged turbulent kinetic energy k with time, for the benchmark incompressible simplified Langevin model case. The dots show the simulation output, while the solid line shows the analytical solution given by Eq. (27). The relative errors remain under 0.35% throughout the simulation.
Current usage metrics show cumulative count of Article Views (full-text article views including HTML views, PDF and ePub downloads, according to the available data) and Abstracts Views on Vision4Press platform.
Data correspond to usage on the plateform after 2015. The current usage metrics is available 48-96 hours after online publication and is updated daily on week days.
Initial download of the metrics may take a while.