Fig. 3
Download original image
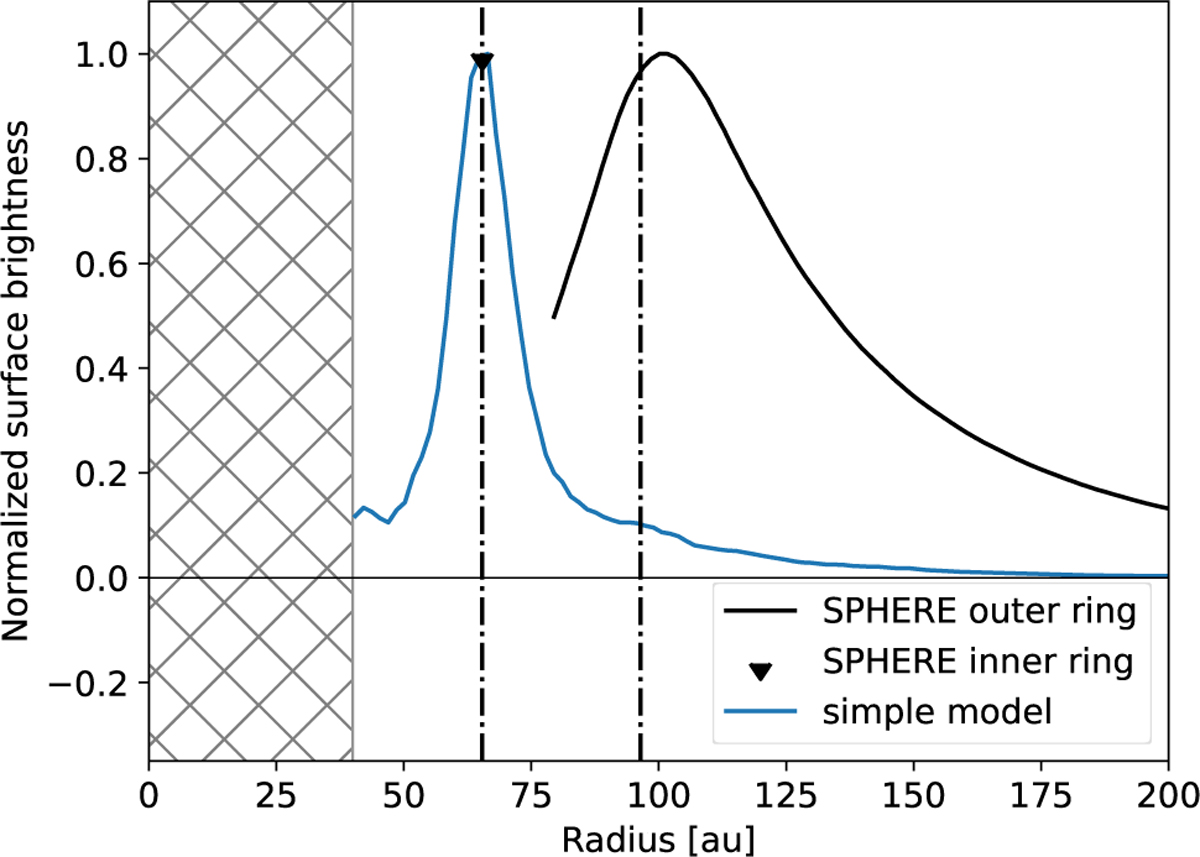
Surface brightness profile of scattered light from the first modelling attempt (blue line). This is based on an assumption that the thermal emission observed with ALMA indicates the spatial distribution of planetesimals feeding an ideal collisional cascade, and the constraints on the SPHERE radial profile based on forward modelling (black line for the outer ring and upper limit for the inner ring). Vertical dash-dot lines indicate the locations of the inner and the outer ring based on local maxima at 65.4 au and 96.5 au in the frank radial profile. The inner 40 au are not included in the model as we focus on the outer regions. See Section 3.1 for details.
Current usage metrics show cumulative count of Article Views (full-text article views including HTML views, PDF and ePub downloads, according to the available data) and Abstracts Views on Vision4Press platform.
Data correspond to usage on the plateform after 2015. The current usage metrics is available 48-96 hours after online publication and is updated daily on week days.
Initial download of the metrics may take a while.