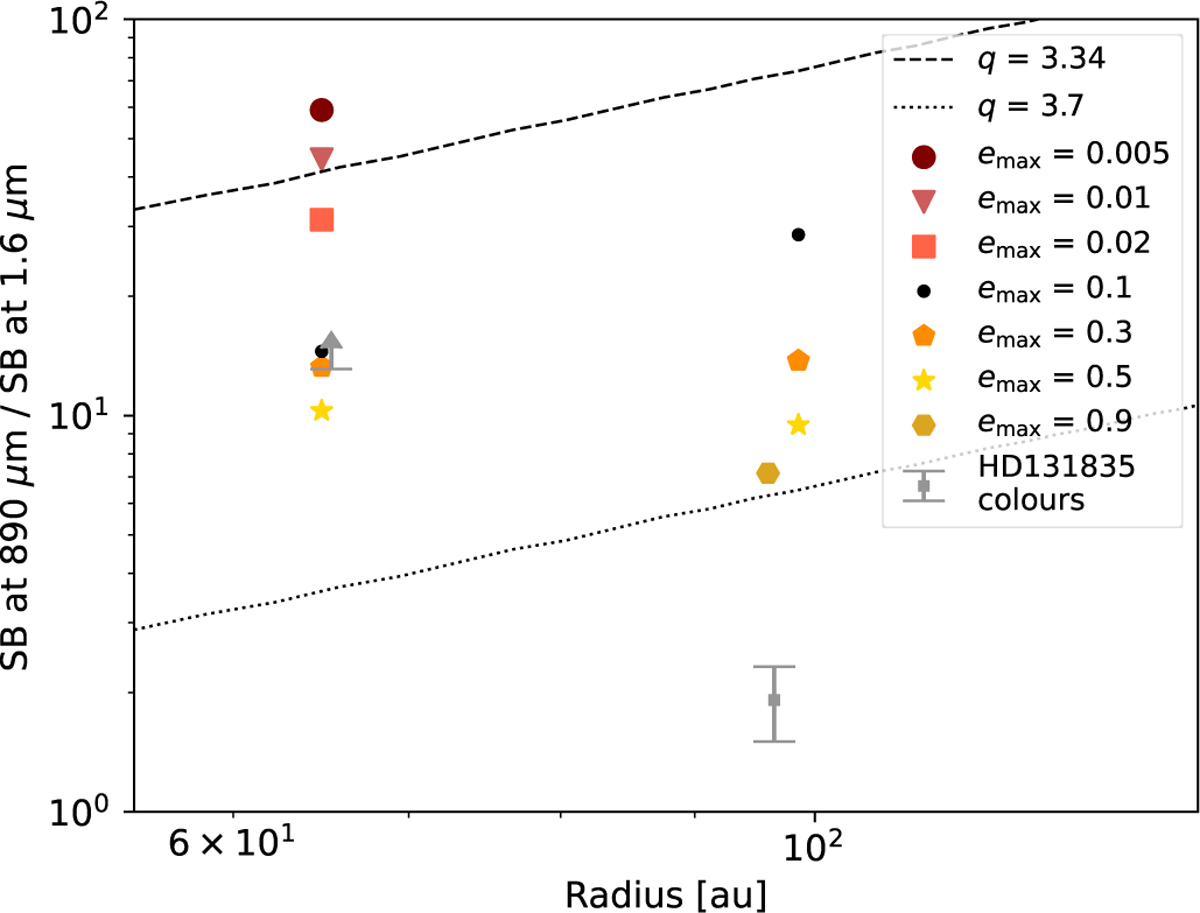
Fig. 4
Download original image
Ratios of peak surface brightnesses at 890 μm and 1.6 μm (colours) shown as function of radii of peak thermal emission, for belt models with various initial excitations. Black dots represent reference cases with a maximum eccentricity emax=0.1, other symbols are as in the plot legend, with different sets of values explored in the two rings. The grey error bars show HD 131835 colours based on the ALMA and the SPHERE observations. Dashed and dotted lines give the expected surface brightness ratios for fiducial, unevolved discs with a fixed power-law size distribution and a minimum grain size of 1 μm. For details, see Section 3.2.
Current usage metrics show cumulative count of Article Views (full-text article views including HTML views, PDF and ePub downloads, according to the available data) and Abstracts Views on Vision4Press platform.
Data correspond to usage on the plateform after 2015. The current usage metrics is available 48-96 hours after online publication and is updated daily on week days.
Initial download of the metrics may take a while.