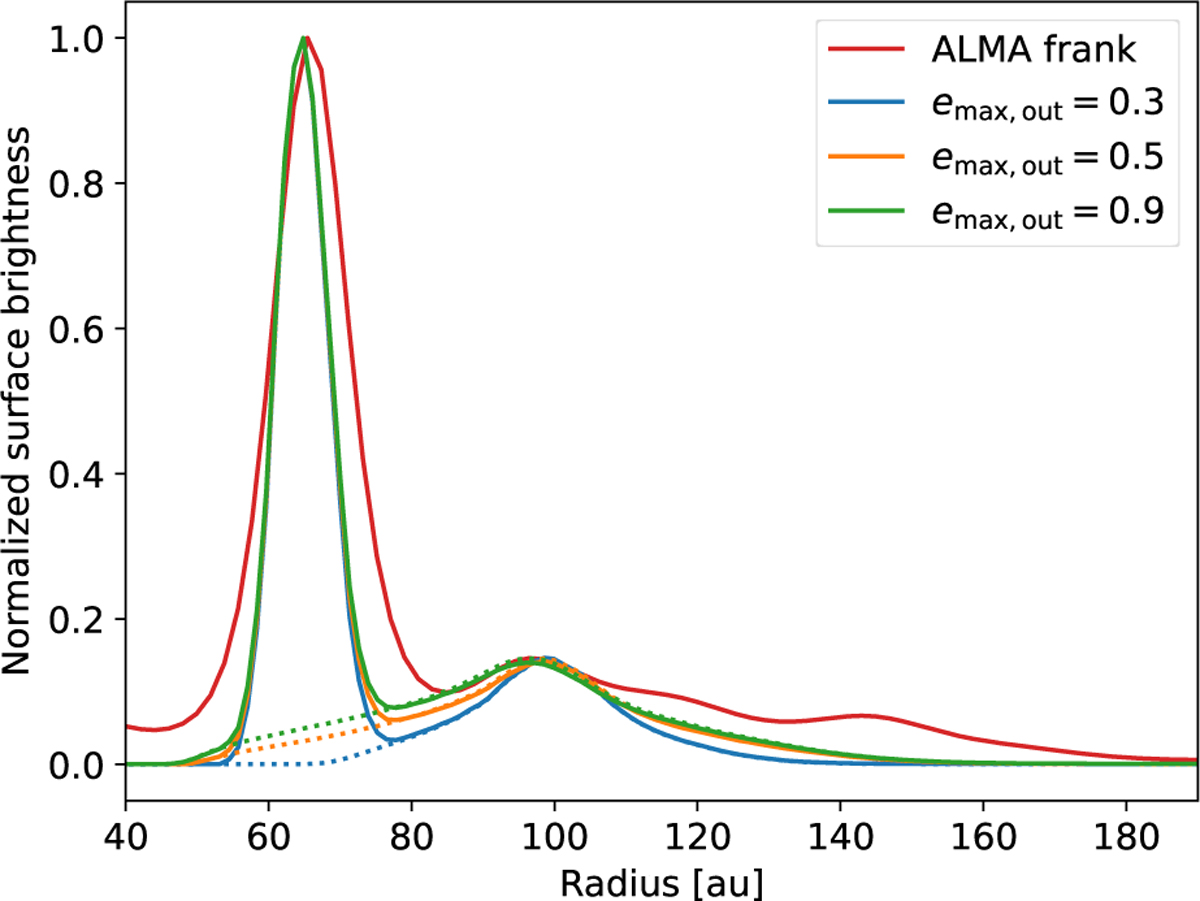
Fig. 5
Download original image
Sum of surface brightness profiles for some combinations of our inner and outer belt models, at 890 μm (solid lines). In each combination the inner belt is the same (emax=0.1) and the outer belt has a different maximum eccentricity, as shown in the plot legend. Dotted lines only show the surface brightness of the outer belt models. The belts are modelled independently, and their peak surface brightness values are re-scaled to ring peak values from frank. The frank profile of HD 131835 is shown in red. For details, see Section 3.2.
Current usage metrics show cumulative count of Article Views (full-text article views including HTML views, PDF and ePub downloads, according to the available data) and Abstracts Views on Vision4Press platform.
Data correspond to usage on the plateform after 2015. The current usage metrics is available 48-96 hours after online publication and is updated daily on week days.
Initial download of the metrics may take a while.