Open Access
Fig. 2.
Download original image
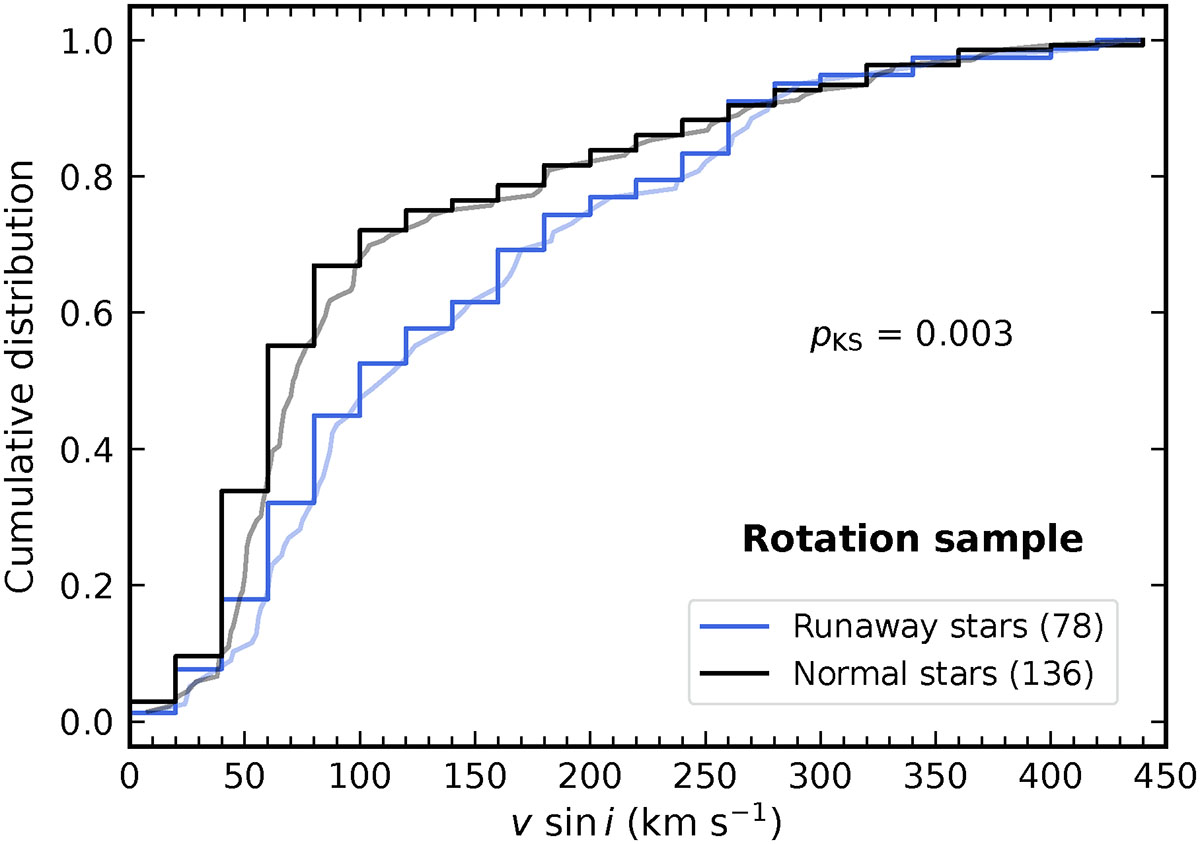
Cumulative distribution functions of v sin i for the 136 O normal (black) and 78 runaway stars (blue) in the rotation sample with bins of ∼20 km s−1. Curves in light colors show the corresponding empirical cumulative distribution functions. pKS is the corresponding p value resulting from the KS test.
Current usage metrics show cumulative count of Article Views (full-text article views including HTML views, PDF and ePub downloads, according to the available data) and Abstracts Views on Vision4Press platform.
Data correspond to usage on the plateform after 2015. The current usage metrics is available 48-96 hours after online publication and is updated daily on week days.
Initial download of the metrics may take a while.