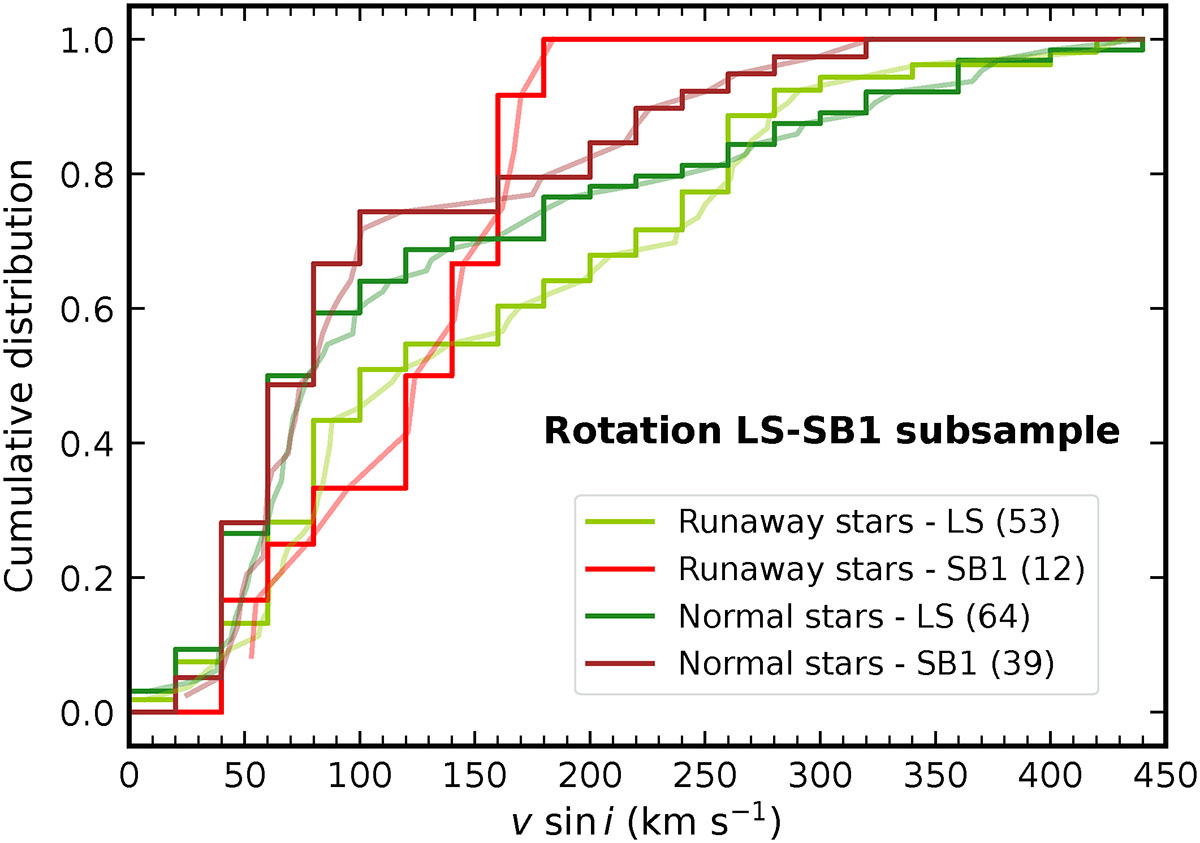
Fig. C.1.
Download original image
Cumulative distribution functions of v sin i for the different sets of the rotation LS-SB1 subsample. LS stars are illustrated in dark and light green, for the normal and runaway stars, respectively. SB1 systems are illustrated in dark and light red, for the normal and runaway stars, respectively. The curves in light colors show the corresponding empirical cumulative distribution functions.
Current usage metrics show cumulative count of Article Views (full-text article views including HTML views, PDF and ePub downloads, according to the available data) and Abstracts Views on Vision4Press platform.
Data correspond to usage on the plateform after 2015. The current usage metrics is available 48-96 hours after online publication and is updated daily on week days.
Initial download of the metrics may take a while.