Open Access
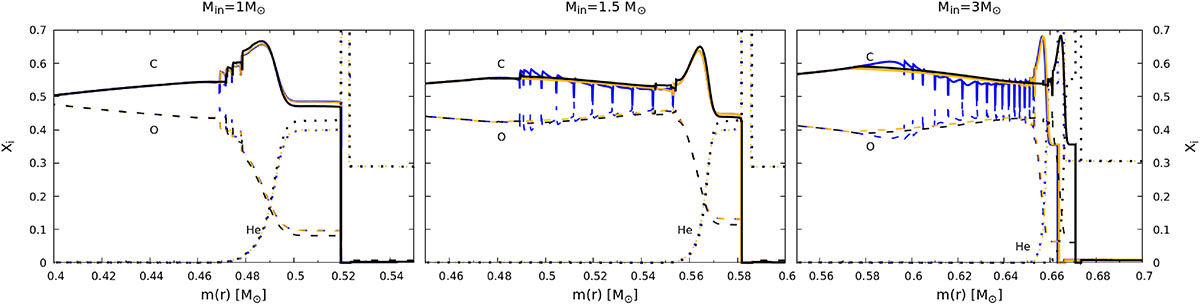
Fig. 1.
Download original image
Chemical abundances of He (dotted lines), C (continuous lines) and O (dashed lines) of stellar models of initial mass Min = 1 M⊙ (left panel), 1.5 M⊙ (middle), and 3 M⊙ (right) at the end of the AGB phase. The blue lines correspond to the case where MLT was used, the orange ones are for MLT♯, and the black ones are for GNA.
Current usage metrics show cumulative count of Article Views (full-text article views including HTML views, PDF and ePub downloads, according to the available data) and Abstracts Views on Vision4Press platform.
Data correspond to usage on the plateform after 2015. The current usage metrics is available 48-96 hours after online publication and is updated daily on week days.
Initial download of the metrics may take a while.