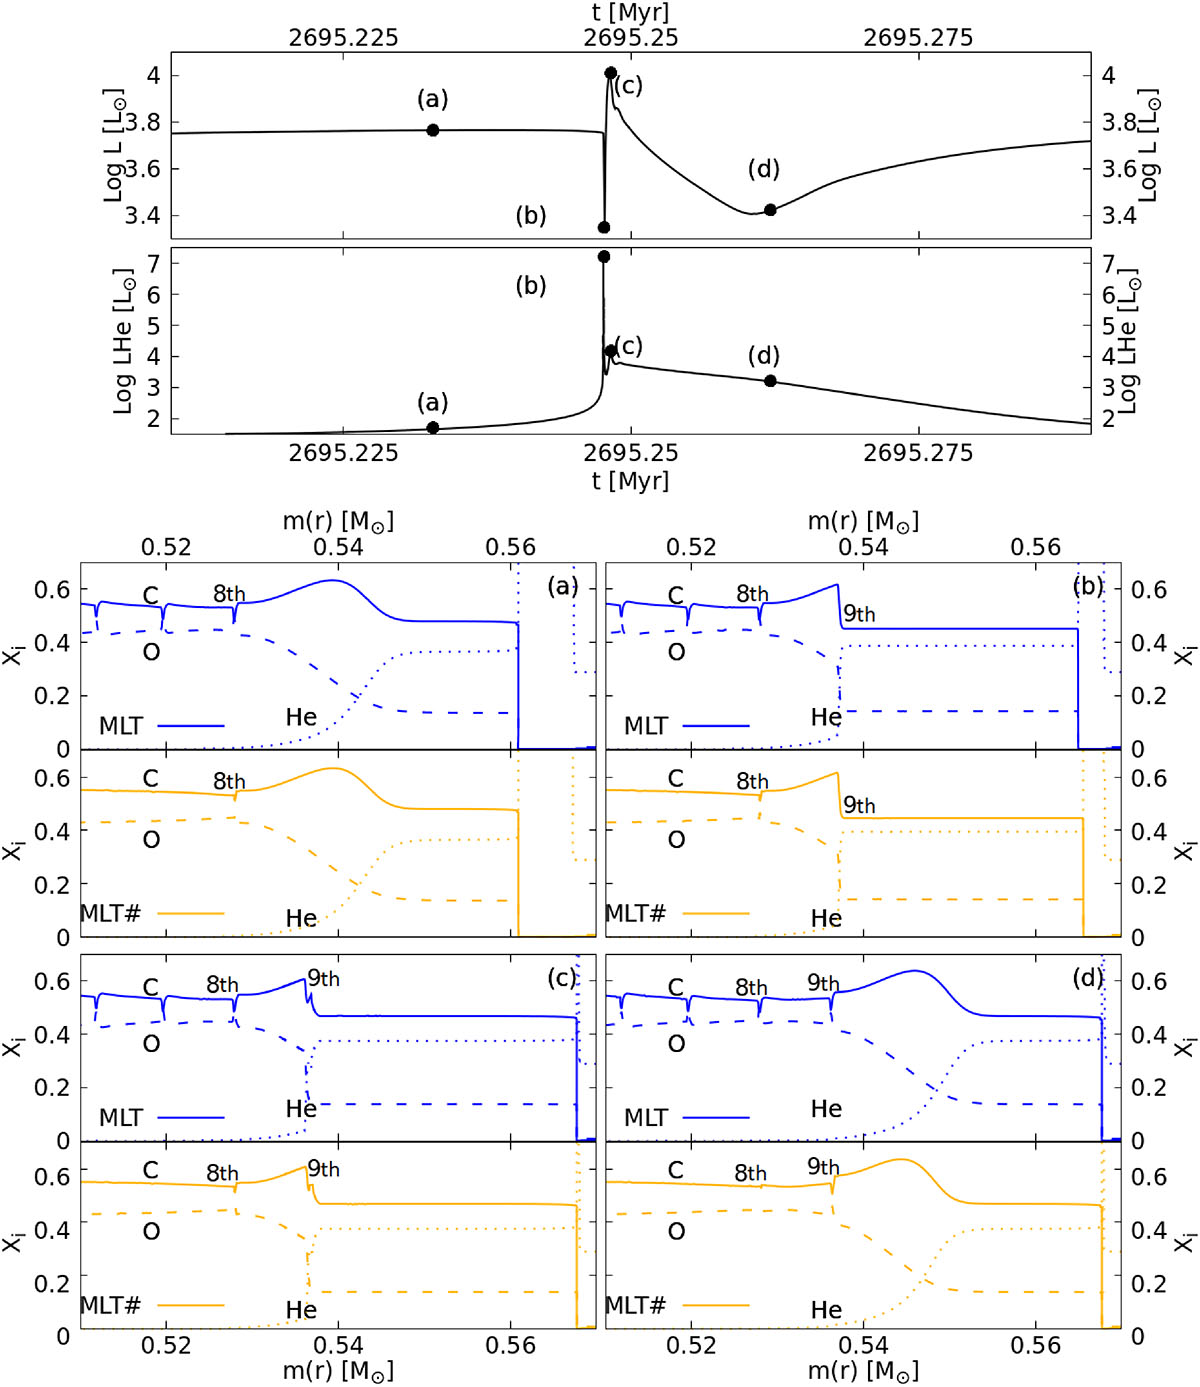
Fig. 2.
Download original image
Top two panels: Surface luminosity (top) and helium luminosity (bottom) during the ninth thermal pulse of the sequence with Min = 1.5 M⊙. Four stages, labeled as a, b, c, and d, are highlighted, which correspond to the chemical stratifications shown in the four bottom panels. Bottom panels: Formation of the O peak during the thermal pulses. Panels b and c show that the O peak is formed in the same way using both prescriptions, while panel d shows how the additional instabilities considered in MLT♯ lead to the mixing of the O peak formed in the previous TP. We also highlight the position of the eighth and ninth O peaks.
Current usage metrics show cumulative count of Article Views (full-text article views including HTML views, PDF and ePub downloads, according to the available data) and Abstracts Views on Vision4Press platform.
Data correspond to usage on the plateform after 2015. The current usage metrics is available 48-96 hours after online publication and is updated daily on week days.
Initial download of the metrics may take a while.