Fig. 1
Download original image
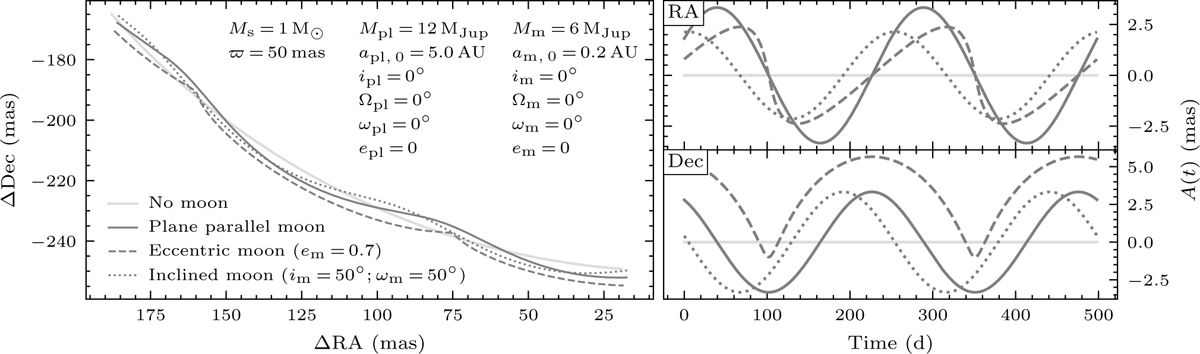
Orbital wobble caused by the perturbing gravitational influence of an exomoon. The left panel shows the orbital trajectory of the moon-hosting planet relative to the star at the origin for different configurations, the right panels display the corresponding astrometric signals in right ascension and declination as a function of time. For visualisation purposes, the mass ratio between moon and planet, Mm/Mpl, used in these examples is unrealistically high to the point that the system would more fittingly be described as a ‘binary planet’. The plane parallel moon case corresponds exactly to the configuration given in the top right of the left hand panel. The eccentric and inclined examples were computed using the adjusted orbital elements specified in the brackets in the bottom left of the panel. The ‘0’ in the indices of the semi-major axes indicate that these values correspond to the separation between the two bodies, that is between the planet–moon barycentre and the host star as well as between the moon and the planet, respectively. In other words, they are the sums of the semi-major axes of the respective hosts and orbiting bodies around their mutual centre of mass. Since we define the inclination of the moon to be 0° and 90° for face-on and edge-on orbits as projected onto the plane of the sky, respectively, simply increasing the inclination results in a dampening and eventual complete suppression of the astrometric signal in the declination component while the right ascension component remains unaffected. For the inclined example, we adjusted the argument of periastron to add a phase shift in the signal so as to better distinguish the different cases.
Current usage metrics show cumulative count of Article Views (full-text article views including HTML views, PDF and ePub downloads, according to the available data) and Abstracts Views on Vision4Press platform.
Data correspond to usage on the plateform after 2015. The current usage metrics is available 48-96 hours after online publication and is updated daily on week days.
Initial download of the metrics may take a while.