Fig. 3
Download original image
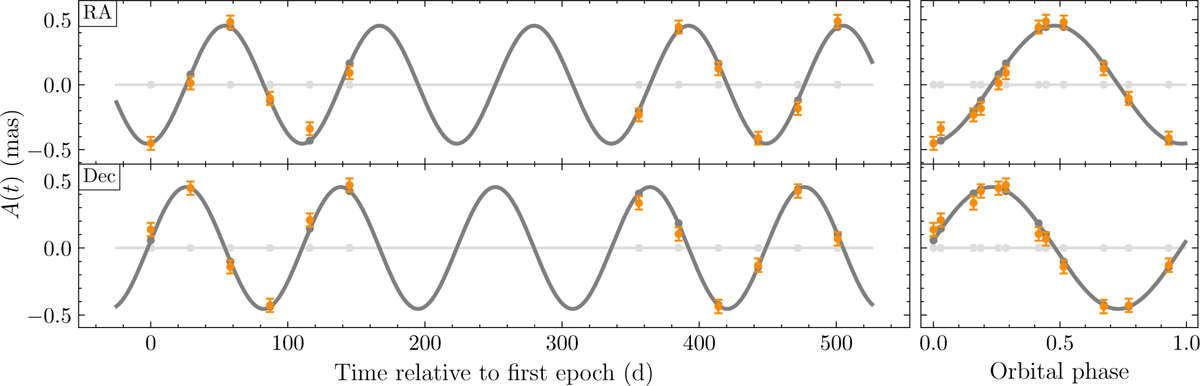
Fiducial astrometric signal in RA and Dec as a function of time for an exemplary system configuration (Ms = 1.5 M⊙, Mpl = 10 MJup, apl, 0 = 10 AU, Mm = 1 MJup, ϖ = 50 mas, am,0 = 0.1 AU, im = 0°, em = 0; see caption of Fig. 1 for index definitions). The dark grey curve indicates the fiducial signal computed using the star–planet–moon model described in Sect. 2.2.2, while the light grey line shows the zero-signal expected in the absence of a moon. The light and dark grey circles show the fiducial momentary signals in RA and Dec when employing the 12 epoch strategy defined in Sect. 4.1. In orange we indicate the associated GRAVITY mock epochs generated according to the procedure outlined in Sect. 4.2. The right hand panels show the same data but phase-folded by the fiducial orbital period.
Current usage metrics show cumulative count of Article Views (full-text article views including HTML views, PDF and ePub downloads, according to the available data) and Abstracts Views on Vision4Press platform.
Data correspond to usage on the plateform after 2015. The current usage metrics is available 48-96 hours after online publication and is updated daily on week days.
Initial download of the metrics may take a while.