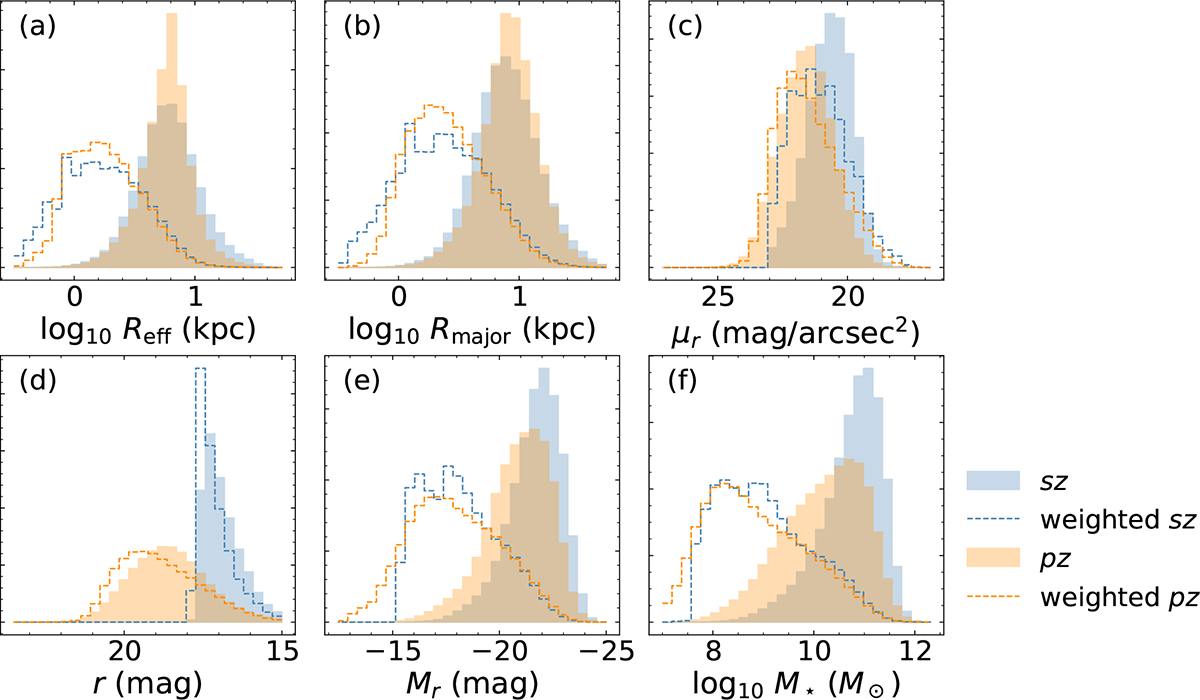
Fig. 1.
Download original image
Summary of the two main galaxy samples we use in this work. Normalized histograms of (a) Reff, (b) Rmaj, (c) μr, (d) r-band magnitude, (e) Mr, and (f) M★ for data with spectroscopic redshift and data with photometric redshift. Filled blue and filled orange show the unweighted distribution of data with spectroscopic redshift and data with photometric redshift. The dashed blue and orange histograms represent the V/Vmax weighted distributions of the spectroscopic and photometric data samples, respectively. The density scale on the vertical axis is arbitrary.
Current usage metrics show cumulative count of Article Views (full-text article views including HTML views, PDF and ePub downloads, according to the available data) and Abstracts Views on Vision4Press platform.
Data correspond to usage on the plateform after 2015. The current usage metrics is available 48-96 hours after online publication and is updated daily on week days.
Initial download of the metrics may take a while.