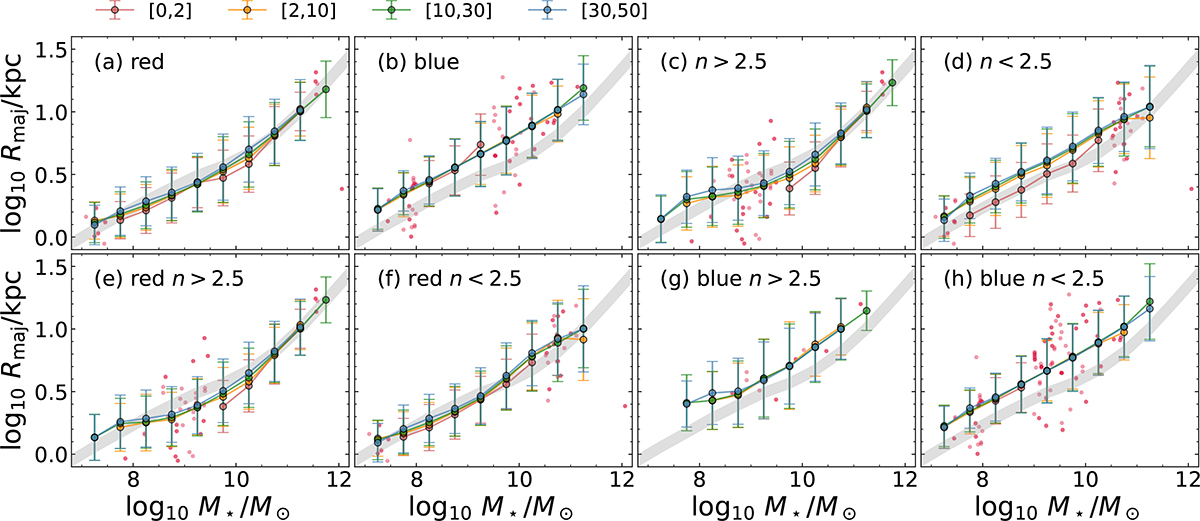
Fig. 10.
Download original image
Size-mass relation for galaxies separated by dcl for (a) red, (b) blue, (c) elliptical, (d) disk, (e) red elliptical, (f) red disk, (g) blue elliptical, and (h) blue disk galaxies. The galaxies with dcl in [0, 2], [2, 10], [10, 30], and [30, 50] Mpc are plotted in red, orange, green, and blue, respectively. The error bars are the dispersion in the likelihood fitting. The gray thick lines show the size-mass relation for all the pz samples. Only the mass bins containing more than 50 galaxies are plotted. The red points represent cluster galaxies with insufficient numbers to determine the mean size.
Current usage metrics show cumulative count of Article Views (full-text article views including HTML views, PDF and ePub downloads, according to the available data) and Abstracts Views on Vision4Press platform.
Data correspond to usage on the plateform after 2015. The current usage metrics is available 48-96 hours after online publication and is updated daily on week days.
Initial download of the metrics may take a while.