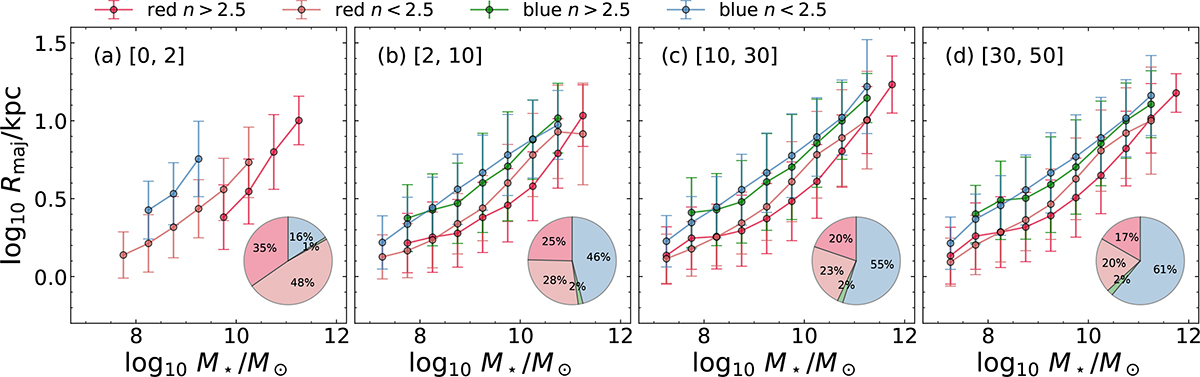
Fig. 11.
Download original image
Size–mass relations for red n > 2.5 (red), red n < 2.5 (pink), blue n > 2.5 (green), and blue n < 2.5 (blue) galaxies in different environments (distance range in megaparsec from the nearest galaxy cluster, shown in the top left of each panel). The pie charts show the fractions of each galaxy type in the corresponding environment. The error bars represent the dispersion of the likelihood fitting.
Current usage metrics show cumulative count of Article Views (full-text article views including HTML views, PDF and ePub downloads, according to the available data) and Abstracts Views on Vision4Press platform.
Data correspond to usage on the plateform after 2015. The current usage metrics is available 48-96 hours after online publication and is updated daily on week days.
Initial download of the metrics may take a while.