Fig. A.1.
Download original image
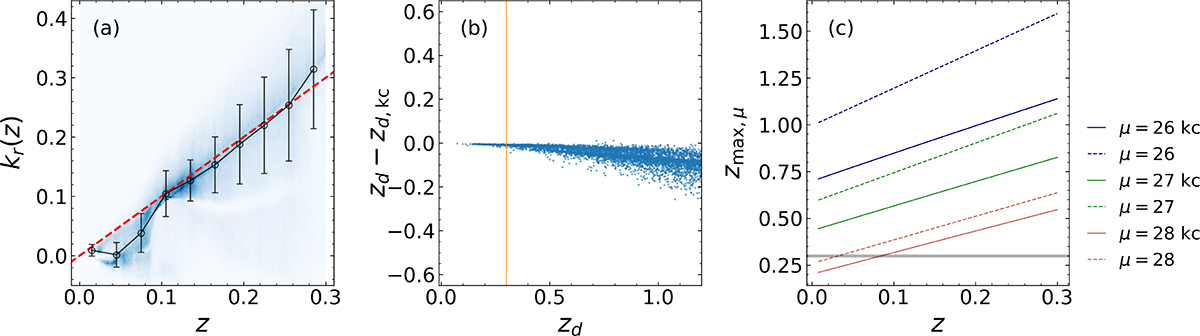
K-correction dependence of redshift trends, luminosity-distance offsets, and surface-brightness detection thresholds. (a) k-correction in the r band as a function of redshift. The blue scale shows the histogram of the distribution, while the black dots indicate the mean values in redshift bins. The error bars represent the standard deviation within each bin. The red dashed line labels the kr(z)∼z relation. (b) Redshift from the maximum luminosity distance versus the difference between values without and with the k-correction. The vertical orange line indicates z = 0.3. (c) Maximum redshift set by the surface brightness limit (zμ) versus redshift. Solid lines show zμ obtained with the k-correction, assuming k(z)≈z for illustration, while dashed lines show zμ computed without k-correction. Different colors indicate results for galaxies with different surface brightnesses. For this test, we set μlim = 29. The horizontal gray line indicates z = 0.3, the maximum redshift limit we impose on our sample.
Current usage metrics show cumulative count of Article Views (full-text article views including HTML views, PDF and ePub downloads, according to the available data) and Abstracts Views on Vision4Press platform.
Data correspond to usage on the plateform after 2015. The current usage metrics is available 48-96 hours after online publication and is updated daily on week days.
Initial download of the metrics may take a while.