Fig. B.1.
Download original image
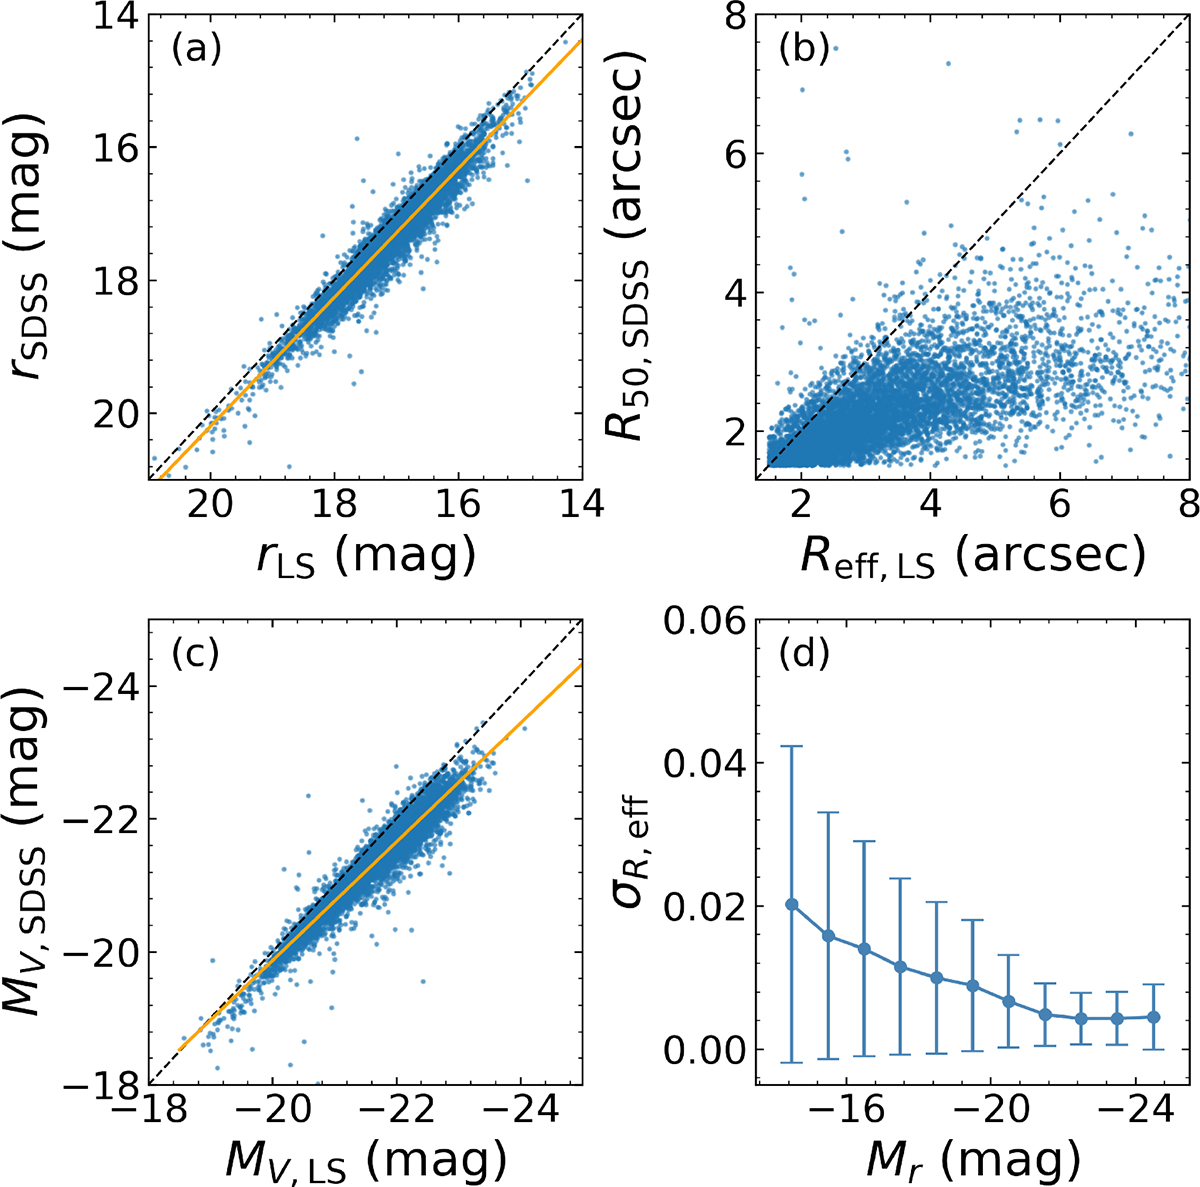
Comparison of sizes measured in SDSS and LS. (a) Apparent r-band magnitude from LS and r−band magnitude obtained from SDSS of randomly selected galaxies. (b) Half-light radius from TRACTOR catalog of the LS survey and the r−band Petrosian half-light radius from SDSS of the randomly selected galaxies. (c) MV converted using rLS and rSDSS. The black dashed lines in both panels are one-to-one relations. The orange line is the fitted relation of r-band magnitudes. (d) Mean error of the modeled size in LS as a function of Mr. The error bars represent the standard deviation of the error within each magnitude bin.
Current usage metrics show cumulative count of Article Views (full-text article views including HTML views, PDF and ePub downloads, according to the available data) and Abstracts Views on Vision4Press platform.
Data correspond to usage on the plateform after 2015. The current usage metrics is available 48-96 hours after online publication and is updated daily on week days.
Initial download of the metrics may take a while.