Open Access
Fig. B.2.
Download original image
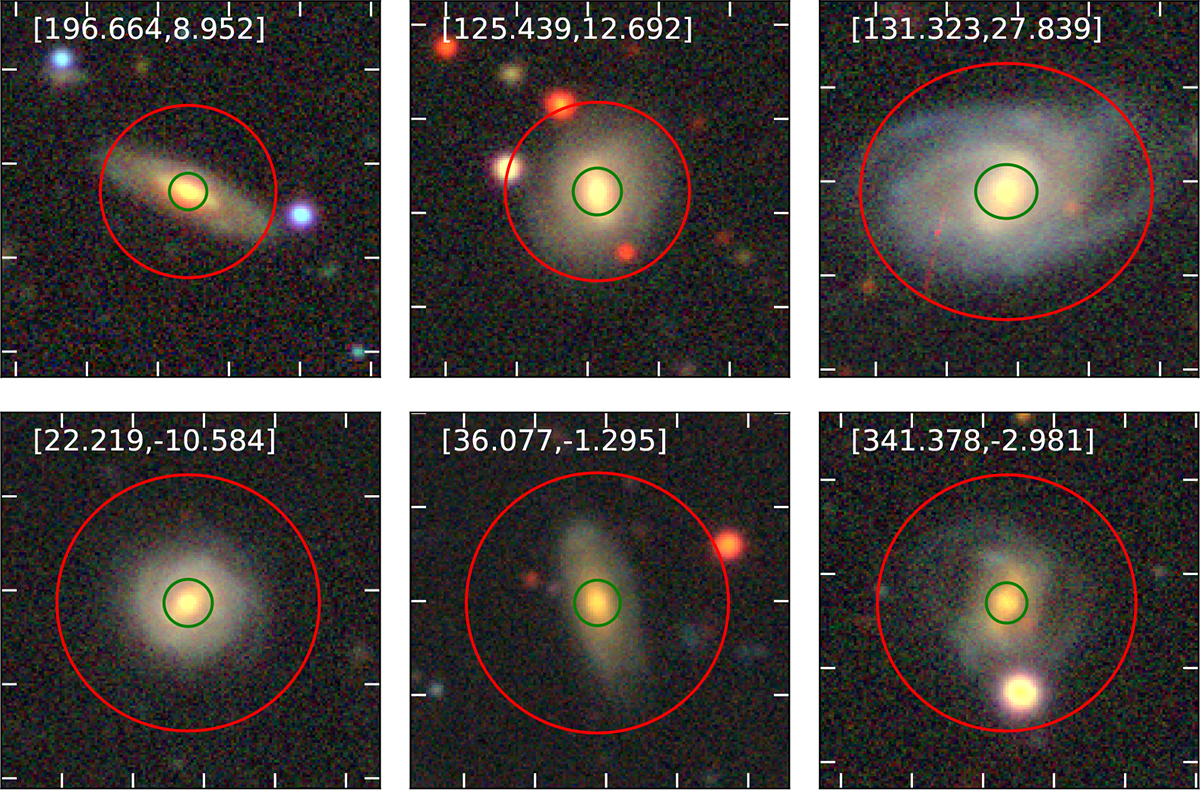
Example galaxies for which the sizes measured in LS are much larger than the Petrosian sizes from SDSS. The RA and Dec of the galaxies are shown in the upper-left corner of each panel. The green circle indicates the SDSS Petrosian size, while the red circle marks the size fitted in LS.
Current usage metrics show cumulative count of Article Views (full-text article views including HTML views, PDF and ePub downloads, according to the available data) and Abstracts Views on Vision4Press platform.
Data correspond to usage on the plateform after 2015. The current usage metrics is available 48-96 hours after online publication and is updated daily on week days.
Initial download of the metrics may take a while.